Allan J. Lichtman, Professor
Department of History
American University
Washington, DC 20016
June 2001
INTRODUCTION
I have been asked by the United States Commission on Civil Rights to consider whether the rejection of ballots as invalid for the 2000 presidential election in Florida had a disparate impact on the votes cast by African-Americans. The analysis will consider all unrecorded ballots as well as the subsets of undervotes (ballots not recorded for the lack of a recognized vote) and overvotes (ballots not recorded for including more than one recognized vote).[1] The focus of analysis will be on whether African-Americans are more likely than other voters to have had their ballots invalidated, although some consideration will be given to reforms of the electoral process in Florida and elsewhere.
BACKGROUND
I am a Professor of History at American University in Washington, D.C. Formerly I served as Department Chair and Associate Dean of the College of Arts and Sciences at American University. I received my BA in History from Brandeis University in 1967 and my PhD in History from Harvard University in 1973, with a specialty in the mathematical analysis of historical data. My areas of expertise include political history, voting analysis, and historical and quantitative methodology. A copy of my curriculum vitae, which accurately sets forth my professional qualifications and experience, is attached as an appendix of this report.
My scholarship includes numerous works on quantitative methodology in social science. These works includes articles in such academic journals as Political Methodology, Journal of Interdisciplinary History, and Social Science History. I have also coauthored with Dr. Laura Langbein Ecological Inference, a standard text on the subject of inferring the behavior of population groups from data collected for political units. In addition, I have published articles on the application of social science analysis to the Voting Rights Act. This work includes articles in such journals as Journal of Law and Politics, La Raza, Evaluation Review, and National Law Journal.
My scholarship also includes the use of quantitative and qualitative techniques to perform political and historical studies of voting, published in such academic journals as The Proceedings of the National Academy of Sciences, The American Historical Review, and The Journal of Social History. Quantitative and historical analysis also grounds my books, Prejudice and the Old Politics: The Presidential Election of 1928, The Thirteen Keys to the Presidency (co-authored with Ken DeCell), and The Keys to the White House.
I have worked as a consultant or expert witness for both plaintiffs and defendants in more than sixty federal voting rights cases. This experience includes numerous cases in the state of Florida. I have been admitted as an expert witness in voting rights, political history, political systems, statistical methodology, quantitative analysis of voting, and socioeconomic analysis, among other matters, in more than fifty federal court cases in which I have presented oral or written testimony.
METHODOLOGY AND DATA
The database for this study includes county level election returns for the presidential election of 2000 in Florida as well as the numbers by county of ballots cast, undervotes, overvotes, and unrecorded votes. Fifty-four of FloridaÆs 67 counties, encompassing 94 percent of ballots cast in 2000, separately recorded undervotes and overvotes. The database includes identification of voting system by county and county level statistics for a variety of social, economic, and political variables, including race and education. The racial data includes the percentage of black registered voters, based on year 2000 voter registration data. The database also included precinct-level data for three of FloridaÆs largest counties: Miami-Dade, Duval, and Palm Beach Counties. This precinct-level data included unrecorded votes, undervotes, overvotes, and voter registration by race, based on 1998 voter registration data.[2]
Florida election returns, voting registration data, and county-by-county lists of voting technology were obtained from the website of the Florida Division of Elections, Department of State. Information on unrecorded votes was obtained from the Governor of FloridaÆs select task force report on the Florida 2000 presidential election, Revitalizing Democracy in Florida, at pages 31-32.[3]
My study utilized simple descriptive statistics as well as the standard statistical method of regression analysis[4] to compare the racial composition of counties and precincts to rates of overall unrecorded votes, overvotes, and undervotes. I also utilized ecological regression[5] that provides estimates from county-level and precinct-level of the percentage of blacks and non-blacks casting unrecorded votes as well as either overvotes or undervotes.[6]Ā Ecological regression procedures were recognized as appropriate for voter analysis by the United States Supreme Court in Thornburg v. Gingles, 478 U.S. 30 (1986).
For the precinct-level data of Palm Beach, Miami-Dade, and Duval Counties, rates of ballot rejection for blacks and non-blacks can also be examined through a technique termed extreme case analysis[7] which examines the rejection rates of ballots including both undervotes and overvotes in precincts that are heavily comprised of registrants that are either black or non-black. The extreme case results will not correspond exactly with the results of ecological regression analysis, because they apply only to some of the precincts within a jurisdiction and those precincts examined include at least some members of other ethnic groups. While not identical, it should closely mirror the pattern of results found in ecological regression. Extreme case analysis involves no inferential procedures. It simply tallies the actual rejection rates, as well as rates of overvoting and undervoting in the precincts chosen for the analysis. The technique of extreme case analysis is applied to precinct-level data in Miami-Dade, Palm Beach and Duval counties with a cutoff rate of precincts that are either 90 percent or more black in their voter registration or 90 percent or more non-black in their voter registration.
SUMMARY OF DETAILED STATISTICAL ANALYSIS
In FloridaÆs 2000 election, about 2.9 percent of all ballots cast (about 180,000 ballots out of slightly more than 6 million ballots cast) did not contain a vote that could be counted as a vote for president. The great majority of these invalid ballots were recorded as either overvotes or undervotes, with overvotes outnumbering undervotes by nearly two to one.[8] Counties that separately recorded overvotes and undervotes rejected about 107,000 ballots as overvotes and about 63,000 ballots as undervotes.
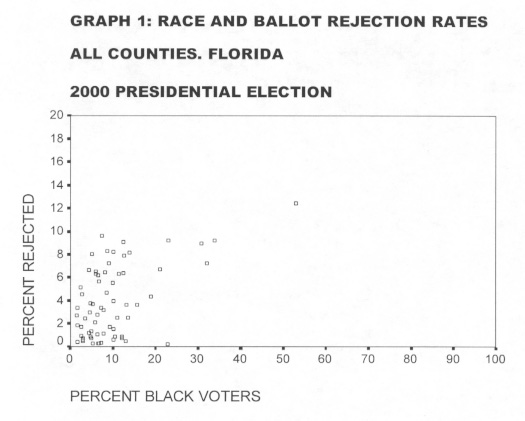
An analysis of the entire state using county-level data and at Miami-Dade, Duval, and Palm Beach counties using precinct-level data, demonstrates that blacks were far more likely than non-blacks to have their ballots rejected in the 2000 Florida presidential election. As illustrated by Graph 1, statewide there is a strong positive correlation between the percentage of black registrants in a county and the percentage of rejected ballots. The linear correlation (termed R) between the percent of ballots rejected in the presidential election and the percentage of blacks among voters[9] is .50, with a squared correlation of (R2) of .25. This means that when we look at the variation in the ballot rejection rates for each county in Florida, about one quarter of that variation can be explained solely by knowing the percentage of blacks who were registered to vote in that county. This relationship is statistically significant at levels far beyond the conventional standards used in social science.[10]
One obvious question is presented by this data ¢ is there some other factor which better explains this disparity in ballot rejection rates? In short the answer is no. This statistically significant county-level correlation between race and ballot rejection rates cannot be attributed to the educational level of African-Americans in Florida. A multiple regression analysis that controlled for the percentage of high school graduates and the percentage of adults in the lowest literacy category failed to diminish the relationship between race and ballot rejection or to reduce the statistical significance of the relationship.
In very small part, the county-level relationship between race and rates of ballot rejection results from the greater propensity of black registered voters to live in counties with technologies that produce the greatest rates of rejected ballots. About 70 percent of black registrants resided in counties using technology with the highest ballot rejection rates ¢ punch cards and optical scanning systems recorded centrally - compared to 64 percent of non-black registrants. Counties using punch card or optical scanning methods recorded centrally rejected about 4 percent of all ballots cast, compared to about .8 percent for counties using optical scanning methods recorded by precinct. The vast majority of rejected votes were recorded in counties using punch cards or optical scanning methods recorded centrally. Such counties included about 162,000 out of 180,000 unrecorded votes in FloridaÆs 2000 presidential election. These counties that used punch cards or optical scanning technology recorded centrally included 65 percent of all ballots cast in FloridaÆs 2000 presidential election, but 90 percent of rejected ballots.
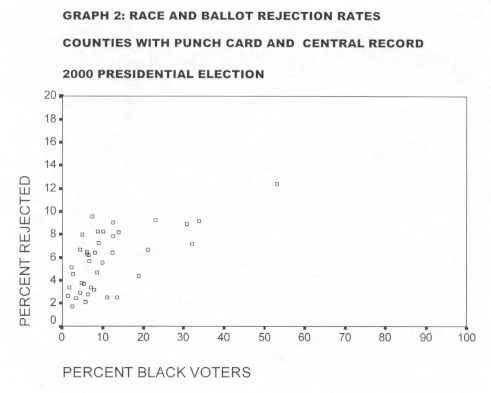
As illustrated in Graph 2, within the group of counties using punch card or optical scanning technology recorded centrally ¢ that account for about 90 percent of rejected ballots -- there is a strong, statistically significant relationship between race and rejected ballots. This correlation between race and ballot rejection is even stronger than the correlation between race and ballot rejection for all counties. The linear correlation between the percent of ballots rejected in the presidential election and the percentage of blacks among voters within the counties using punch cards or optical scanning machinery recorded centrally is .56, with a squared correlation of (R2) of .31, a stronger relationship between race and rejected ballots than for the state overall. This means that nearly one-third of the county-by-county variation in the rates of rejected ballots within this group of counties can be predicted solely by knowing the racial composition of the counties. This relationship is statistically significant at levels far beyond the conventional standards used in social science.[11]
When the counties using the technology with the lowest ballot rejection rates are examined, the correlation between race and ballot spoilage is substantially reduced but not eliminated. There remains a statistically significant relation between race and the rate at which ballots are spoiled even when the best technology is used. The linear correlation between the percent of ballots rejected in the presidential election and the percentage of blacks among registrants within the counties using optical scanning machinery recorded by precinct is .28, with a squared correlation of (R2) of .08, a weaker relationship between race and rejected ballots than for the state overall. This means that slightly less than one-tenth of the county-by-county variation in the rates of rejected ballots within this group of counties can be predicted solely by knowing the racial composition of the counties. The relationship is not statistically significant at conventional standards used in social science. In summary, while the type of technology used accounts for some of the relationship between race and the rate at which ballots are rejected, there remains a statistically significant relationship even after education is considered and the type of voting system is taken into account.
These correlations, however suggestive of a strong relationship between race and ballot rejection, pertain only to county-level relationships. They do not by themselves provide estimates of the ballot rejection rates for the black and non-black voters included for the entire state. The ecological regression technique does provide these estimates for the state overall. As reported in Chart 1 and Table 1, the results are striking. For the entire state, the rates of rejection for votes cast by blacks was an estimated 14.4 percent, compared to a rate of 1.6 percent for votes cast by non-blacks. The greatest discrepancy is for overvotes, with an estimated rejection rate of 12.0 percent for votes cast by blacks, compared to an estimated rate of 0.6% for votes cast by non-blacks.
|
TABLE 1: ECOLOGICAL REGRESSION ESTIMATES OF STATEWIDE BALLOT REJECTION RATES BY RACE |
||||||
|
INVALID VOTES* |
OVERVOTES |
UNDERVOTES |
||||
|
PUNCH CARD & CENTRAL RECORD COUNTIES |
BLACK VOTERS |
NON-BLACK VOTERS |
BLACK VOTERS |
NON-BLACK VOTERS |
BLACK VOTERS |
NON-BLACK VOTERS |
|
19.4% |
2.2% |
17.1% |
.8% |
2.4% |
1.3% |
|
|
|
||||||
|
PRECINCT RECORD COUNTIES |
BLACK VOTERS |
NON-BLACK VOTERS |
BLACK VOTERS |
NON- BLACK VOTERS |
BLACK VOTERS |
NON-BLACK VOTERS |
|
5.2% |
.4% |
2.5% |
.2% |
2.1% |
.1% |
|
|
|
||||||
|
ALL COUNTIES COMBINED |
BLACK VOTERS |
NON-BLACK VOTERS |
BLACK VOTERS |
NON-BLACK VOTERS |
BLACK VOTERS |
NON-BLACK VOTERS |
|
14.4% |
1.6 |
12.0% |
.6% |
2.3% |
1.2% |
|
|
|
||||||
|
* THE RATES FOR REJECTED VOTES ARE NOT EXACTLY EQUAL TO THE SUM OF RATES FOR OVERVOTES AND UNDERVOTES. SOME INVALID VOTES WERE NOT SUBDIVIDED INTO EITHER OF THESE TWO CATEGORIES. ALSO, 13 COUNTIES DO NOT SEPARATELY RECORD OVERVOTES AND UNDERVOTES. ESTIMATES FOR ALL COUNTIES ARE WEIGHTED MEANS OF ESTIMATES FOR PUNCH CARD AND CENTRAL RECORD AND FOR PRECINCT RECORD COUNTIES. |
||||||
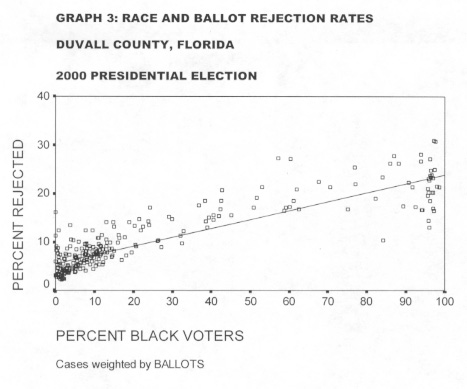
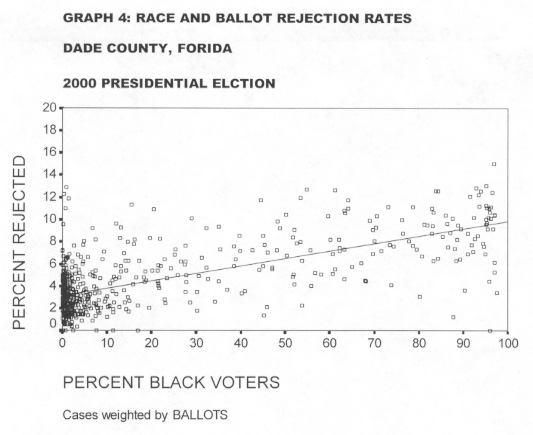
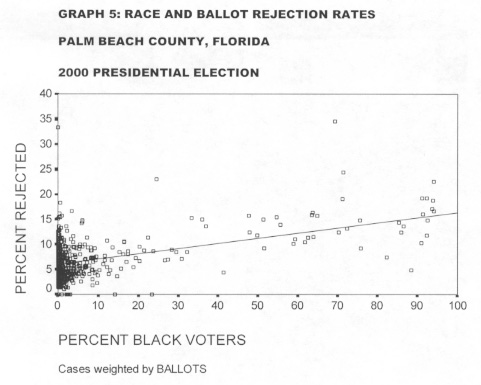
In order to further refine this analysis, precinct data for Duval, Miami-Dade, and Palm Beach counties were examined. These counties have substantial numbers of African- Americans.[12] Duval County, with a 9.2 ballot rejection rate had a much higher rate than the 4.0 average for punch card counties, whereas Miami-Dade County had a rejection rate of 4.4 percent ¢ close to the punch card average. Palm Beach County had an intermediate rejection rate of 6.4 percent. Taken together, the three counties included about 85,000 rejected ballots, about 47 percent of the statewide total. Precinct-by-precinct rejection rates and black voter percentages for each county are reported in Graphs 3, 4, and 5. For these graphs, with large numbers of precincts, the graphs also include the linear regression line to portray with clarity the relationship within the graph between race and ballot rejection.
As indicated by the results of ecological regression analysis reported in Charts 2, 3 and 4, and Table 2, the estimated rejected rates derived from precinct-level data in these three counties confirm the findings derived from county-level data for the entire state. In Duval, Miami-Dade, and Palm Beach counties, as in the state overall, blacks were far more likely than non-blacks to experience the rejection of ballots cast in FloridaÆs 2000 presidential election.
|
TABLE 2: ECOLOGICAL REGRESSION AND EXTREME CASE ANALYSIS OF DUVAL, MIAMI-DADE AND PALM BEACH COUNTY BALLOT REJECTION RATES BY RACE |
||||||
|
ECOLOGICAL REGRESSION RESULTS |
||||||
|
INVALID VOTES |
OVERVOTES |
UNDERVOTES |
||||
|
DUVAL COUNTY |
BLACK VOTERS |
NON-BLACK VOTERS |
BLACK VOTERS |
NON-BLACK VOTERS |
BLACK VOTERS |
NON-BLACK VOTERS |
|
23.6% |
5.5% |
20.8% |
4.1% |
2.8% |
1.4% |
|
|
|
||||||
|
DADE COUNTY |
BLACK VOTERS |
NON-BLACK VOTERS |
BLACK VOTERS |
NON-BLACK VOTERS |
BLACK VOTERS |
NON-BLACK VOTERS |
|
9.8% |
3.2% |
7.2% |
1.9% |
2.6% |
1.3% |
|
|
|
||||||
|
PALM BEACH COUNTY |
BLACK VOTERS |
NON-BLACK VOTERS |
BLACK VOTERS |
NON-BLACK VOTERS |
BLACK VOTERS |
NON-BLACK VOTERS |
|
16.3% |
6.1% |
14.3% |
3.9% |
2.2% |
2.1% |
|
|
EXTREME CASE RESULTS |
||||||
|
INVALID VOTES |
OVERVOTES |
UNDERVOTES |
||||
|
DUVAL COUNTY |
90%+ BLACK PRECINCTS |
90%+ NON-BLACK PRECINCTS |
90%+ BLACK PRECINCTS |
90%+ NON-BLACK PRECINCTS |
90%+ BLACK PRECINCTS |
90%+ NON-BLACK PRECINCTS |
|
22.1% |
5.8% |
19.2% |
4.3% |
2.9% |
1.4% |
|
|
|
||||||
|
DADE COUNTY |
90%+ BLACK PRECINCTS |
90%+ NON-BLACK PRECINCTS |
90%+ BLACK PRECINCTS |
90%+ NON-BLACK PRECINCTS |
90%+ BLACK PRECINCTS |
90%+ NON-BLACK PRECINCTS |
|
9.1% |
3.2% |
6.6% |
1.9% |
2.5% |
1.3% |
|
|
|
||||||
|
PALM BEACH COUNTY |
90%+ BLACK PRECINCTS |
90%+ NON-BLACK PRECINCTS |
90%+ BLACK PRECINCTS |
90%+ NON-BLACK PRECINCTS |
90%+ BLACK PRECINCTS |
90%+ NON-BLACK PRECINCTS |
|
16.1% |
6.2% |
13.8% |
4.0% |
2.3% |
2.2% |
|
For Duval County, as demonstrated in Chart 2, the overall rate of rejection for votes cast by blacks was an estimated 23.6 percent, compared to a rate of 5.5 percent for votes cast by non-blacks. The greatest discrepancy is for overvotes, with an estimated rejection rate of 20.8 percent for votes cast by blacks, compared to an estimated rate of 4.1 percent for votes cast by non-blacks. For Miami-Dade County, as demonstrated in Chart 3, the overall rate of rejection for votes cast by blacks was an estimated 9.8 percent, compared to a rate of 3.2 percent for votes cast by non-blacks. The greatest discrepancy is again for overvotes, with an estimated rejection rate of 7.2 percent for votes cast by blacks, compared to an estimated rate of 1.9 percent for votes cast by non-blacks. For Palm Beach County, as demonstrated in Chart 4, the overall the rate of rejection for votes cast by blacks was an estimated 16.3 percent, compared to a rate of 6.1 percent for votes cast by non-blacks. The greatest discrepancy is for overvotes, with an estimated rejection rate of 14.3 percent for votes cast by blacks, compared to an estimated rate of 3.9 percent for votes cast by non-blacks.[13]
As demonstrated by Charts 5, 6, and 7, the results of extreme case analysis for 90%+ black and non-black precincts confirm the findings of ecological regression analysis. For Duval County, as demonstrated by Chart 5, in precincts that were 90 percent or more black in their voter registration the overall rate of rejection was 22.1 percent, compared to a rate of 5.8 percent for precincts that were 90 percent or more non-black in their voter registration. For Miami-Dade County, as demonstrated by Chart 6, the overall rate of rejection for votes cast by blacks was an estimated 9.1 percent, compared to a rate of 3.2 percent for votes cast by non-blacks. As reflected in Chart 7, in Palm Beach County the overall rejection rate for votes cast by blacks was an estimated 16.1 percent compared to 6.2 percent in the non-black precincts.
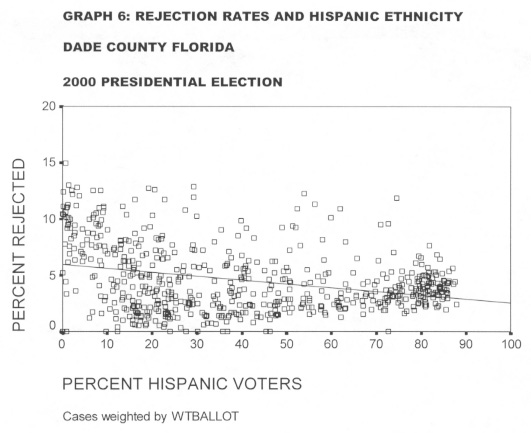
It should be stressed that the purpose of this study was to determine whether there existed in the Florida 2000 presidential election disparities between the ballot rejection rates of blacks and non-blacks. The purpose was not to establish the causes of any such disparities. However, the presence within Dade County of a substantial Hispanic population provides an opportunity to test whether differences in education are likely to have been responsible for the racial disparities in ballot rejection rates between blacks and non-blacks in that county. In Dade County, the high school graduation rate of Hispanic was about one percentage point below the rate for blacks. In addition Hispanics faced language barriers to voting issues. If educational differences were responsible for racially disparate ballot rejection rates in Dade County we should expect a positive relationship between the percentage of Hispanic registrants in Dade County precincts and the percentage of rejected ballots. As illustrated in Graph 6, however, the relationship is a negative one, with ballot rejection rates lower in heavily Hispanic than in heavily non-Hispanic (many of them black) precincts. A multivariate ecological regression equation that includes the percentage of Hispanics as well as blacks in the precincts of Dade County, produces an estimated ballot rejection rate for blacks of 10.0 percent, an eyelash higher than the rate of 9.8 percent derived from the bivariate equation.[14]
In the presidential election of 2000, for these three counties as well as for the state overall, the percentage of blacks among voters with rejected ballots was far greater than the black percentage of all voters. Although the statewide results are estimates derived from county-level data that should be interpreted with caution, the wide disparity they reveal between rejection rates for blacks and non-blacks are confirmed by the precinct level analysis for Duval, Miami-Dade, and Palm Beach counties.[15] The greatest disparities were found not for the undervotes that have been the focus of media attention, but for overvotes ¢ voting for more than one candidate. Overall, about twice as many Florida ballots were rejected in the 2000 presidential election as overvotes than as undervotes.
These discrepancies in small part reflect the greater concentration of blacks as compared with non-blacks in counties using the technologies that produce the greatest percentage of rejected ballots. The evidence from Duval, Miami-Dade, and Palm Beach counties indicates that major racial disparities in ballot rejection rates are found within counties using punch card technologies. Within Duval County, based on precinct-level information, statistical estimates show that black voters were more than four times more likely than white voters to have their ballots rejected in the 2000 election. Within Miami-Dade County, based on precinct-level information, statistical estimates show that black voters were more than three times more likely than white voters to have their ballots rejected in the 2000 election. Within Palm Beach County, based on precinct-level information, statistical estimates show that black voters were nearly three times more likely than white voters to have their ballots rejected in the 2000 election.
In the three counties, the rate of rejected ballots by African-Americans ranged from about 10 percent to about 24 percent. For all three counties combined, the rate of rejected ballots averaged about 15 percent ¢ meaning that one out of every seven African-Americans that entered the polling booth in these counties had his or her ballot rejected as invalid. These results closely mirror the county-level findings for the state overall. In these counties, the ballot rejection rate forĀ non-African-Americans ranged from about 3 percent to 6 percent, averaging just under 5 percent. Thus the racial gap was just above 10 percentage points, enough to account for the rejection of more than 20,000 additional African-American ballots in these three counties alone.[16]
Part of the problem of ballot rejection for African-Americans in Florida can be solved by requiring the adoption of optical scanning system recorded by precinct for all counties in the state. Based on the 2000 experience, a uniform system of technology, like optical scan systems tabulated at the precinct level, would reduce the level of invalid ballots for both blacks and non-blacks. However, the use of this technology will not eliminate the disparity between the rates at which ballots cast by blacks and whites are rejected. County-level estimates indicate that even in counties using optical scanning methods recorded by precinct, the rejection rate for ballots cast by blacks was still about 5 percent compared to well under 1 percent for non-blacks.[17]
Technology alone is not the answer to racial discrepancies in ballot rejection. The results of these analyses demonstrate that technological change must be accompanied in all counties by effective programs of education for voters, for election officials, and for poll workers. Obviously sufficient resources must be devoted to the maintenance of voting technology and steps must be taken to assure clear and comprehensive voter instructions, easily understandable ballots, and adequate resources to assist voters at all polling places.
[1] For counties that separately record undervotes and overvotes, the total number of unrecorded votes is slightly higher than the sum of undervotes and overvotes, given that not every rejected ballot was separately classified as an undervote or overvote.
[2] The county-level correlation between the percentage of black registrants for 1998 and 2000 is a near-perfect .996.
[3] Additional data on undervotes and overvotes was obtained from the data tables in Siegel v. Lepore, 234 F.3d 1163 (11th Cir. 2000) and from CNN and Associated Press, >http:www.cnn.com/ELECTION/2000/resources/ballot1.htm<.Ā Precinct level data for Duval County, Miami-Dade, and Palm Beach County was obtained from the website of Bruce E. Hansen, Stockwell Professor of Economic, University of Wisconsin-Madison: >http://www.ssc.wisc.edu/~bhansen/vote/data.html<. Socio-economic data was obtained from the 1990 Census (such data is not yet available for 2000). Estimates of literacy rates were obtained from CASAS, öSynthetic Estimates Of Literacy, Percent Level 1, National Adult Literacy Survey.ö
[4] Regression analysis measures the influence of one or more variables, known as independent variables, on another variable known as the dependent variable. When used for political units such as the counties of Florida or the precinct within a county, regression analysis measures the extent to which the value of the dependent variable changes from one unit to another in response to changes in the values of the independent variables. For a brief description of regression analysis see: Hubert M. Blalock, Social StatisticsĀ (New York: McGraw Hill, 1979), pp. 382-386.
[5] Ecological regression is a standard method for inferring the behavior of population groups from data collected for aggregate units such as counties or precincts. It produces such estimates by comparing the racial composition of the various voting precincts to the division of the vote among competing candidates in each precinct. The ecological regression procedure for analyzing the behavior of population groups is set forth in my book, Ecological Inference (Sage Series on Quantitative Applications in Social Science, 1978: with Laura Irwin Langbein). Other references on the use of ecological regression for voting analysis include: Richard Engstrom, "Quantitative Evidence in Vote Dilution Litigation: Political Participation and Polarized Voting," Urban LawyerĀ (1985); Bernard Grofman and Chandler Davidson, eds., Controversies in Minority Voting: The Voting Rights Act in Perspective (Cambridge: Cambridge University Press, 1992); Bernard Grofman, Lisa Handley, and Richard G. Niemi, Minority Representation and the Quest for Voting Equality (Cambridge: Cambridge University Press, 1992); Allan J. Lichtman, ōPassing the Test: Ecological Regression in the Garza Case and Beyond,ö Evaluation ReviewĀ (1991).
[6] Non-blacks include non-Hispanic whites as well as Hispanics and members of other races. Because of limitations in the data available, no attempt was made to distinguish the components of the non-black group, although racial disparities might be even greater if blacks and non-Hispanic whites were isolated for analysis.
[7] Extreme case analysis is designed to isolate nearly homogeneous groups of blacks and non-blacks by examining precincts within each county studied that are either 90 percent or more black or 90 percent or more non-black in their voter registration. The analysis simply reports the actual ballot rejection rates in these precincts that are comprised overwhelmingly of black or non-black registrants. Extreme case analysis provides a very useful check on the results of ecological regression analysis. It provides a comparison of actual rejection rates in nearly homogeneous black and non-black precincts with estimated rejection rates for blacks and non-blacks in all precincts derived from ecological regression analysis. For descriptions of extreme case analysis and its relation to ecological regression analysis see: Lichtman, ōPassing the Test,ö and Grofman, et. al., Minority Representation, pp. 85-90.
[8] As noted above, not every rejected ballot in Florida was separately classified as either an undervote or an overvote.
[9] The analysis first used ecological regression to estimate the turnout rates of blacks and non-blacks (which were nearly equal) and then applied those rates to estimate the percentage of blacks among voters. The number of registrants or of ballots cast weights all correlation and regression analyses. Statistical significance results, however, are based on the number of counties included in each analysis.
[10] These correlations are consistent with those found by the Commission in its own preliminary analysis of rejected ballots.
[11] As for the state overall, within this group of counties that account for most rejected ballots, a multiple regression analysis that controlled for the percentage of high school graduates and the percentage of adults in the lowest literacy category failed to diminish the relationship between race and ballot rejection or to reduce the statistical significance of the relationship.
[12]Ā Duval County is 24 percent African American. Dade County is 20 percent African-American, and Palm Beach County is 9 percent African-American based upon 2000 voter registration. All three used punch card technology.
[13] For each of the three counties studied, the correlation between race and ballot rejection is high and statistically significant well beyond conventional standards in social science. For Duval County, R = .89 and R2 Ā= .791; For Miami-Dade County, R = .73 and R2 Ā= .53; For Palm Beach County, R = .50 and R2 Ā= .25.
[14] The insertion of the percentage of Hispanics into the county-level regression equations used for statewide estimates likewise produces a higher estimate of the rate of rejection for ballots cast by African-Americans.
[15] Databases for the three individual counties and for the county-level analysis are appended to this report.
[16]Ā These averages are weighted by ballots cast. Unweighted averages are 17% for African-Americans and 5% for non-African-Americans: a gap of about 12 percentage points in ballot rejection. Precinct-level data was not available for counties with the highest percentages of African Americans, which also have high rates of ballot rejection.
[17] It should be noted that these estimates are only suggestive of the relationship between race and ballot rejection for this limited group of counties. As already indicated, for these counties, the correlation between race and ballot rejection is relationship is positive, but not statistically significant.