Non-Voted Ballots and Discrimination in Florida
John
R. Lott, Jr.
School of Law
Yale University
127 Wall Street
New Haven, CT 06511
(203) 432-2366
john.lott@yale.edu
revised
July 15, 2001
* This paper was originally written at the request of the minority members of the U.S. Commission on Civil Rights. I received no compensation for this work.
I) Introduction
The U.S. Commission on Civil Rights' Majority Report on the 2000 Presidential vote in Florida presents two types of empirical evidence that African-Americans were denied the right to vote.[1] The report concluded that, "The Voting Rights Act prohibits both intentional discrimination and results discrimination. It is within the jurisdictional province of the Justice Department to pursue and a court of competent jurisdiction to decide whether the facts prove or disprove illegal discrimination under either standard. [2] To reach their conclusion that discrimination had occurred, the majority examined the impact of race on spoiled (or non-voted) ballot rates as well as the impact of race on the exclusion from voter eligibility lists because of past felony criminal records. They relied on empirical work regarding non-voted ballots and this empirical work relies solely on cross county regressions or correlations using data from 2000 alone. The evidence that African-Americans are erroneously placed on the ineligible list at higher rates than other racial groups is based upon a simple comparison of means.
My examination of the data however demonstrates three things:
1) The Majority Report's conclusion of "a direct correlation between race and having one's vote discounted as a spoiled ballot" is quite sensitive to the specification used. Using their method, non-voted ballot rates increase as the percentage of African-Americans rises, if they increase at all, when the county election supervisor is a Democrat and/or an African-American.
2) The Majority Report fails to account for which counties had high rates of non-voted ballots in the past. We find that once these past rates are accounted for, additional increases in the percent of voters in a county who are African-American are not related to changes in the rate that ballots are not voted. While the difference is not statistically significant, the ballot non-voting rate is slightly more positively related to the share of white voters than African-American voters.
3) The Majority Report's own evidence that African-Americans are erroneously included on the ineligible list at higher rates than other racial groups actually shows the opposite of what they think that it does. The evidence that African-Americans win a greater share of successful appeals does not account for the fact that African-Americans make up an even much greater share of the list of ineligible voters to begin with. In fact, the rate that whites are removed from the list because they were incorrectly included to begin with is almost twice the rate of African-Americans.
The evidence thus indicates that even if the commission is correct on the law (and there is some debate on that),[3] it is difficult to accept the commission's conclusion that discrimination occurred unless one believes that black democratic county election supervisors were responsible for higher non-voted ballot rates by African-American voters. The following sections will first evaluate the data on non-voted ballots and then turn to the data on African-Americans being erroneously excluded from voting due to felony criminal records.
II) Re-examining the Simple Correlations and Means
Ideally any analysis of non-voted ballots and race would directly link whether individuals in a particular group actually had non-voted ballots. Yet, there is obviously no such data. Lacking that direct link, the Majority Report attempts to see whether counties or precincts with a higher percentage of African-Americans have a higher percentage of non-voted ballots. The Majority Report interprets such a link as discrimination.
The Majority Report provides many scatter plots to illustrate this correlation across precincts and counties. The problem is that all the evidence produced in the Majority Report is based on purely cross-sectional evidence. Yet, purely cross-sectional evidence suffers from well-known weaknesses in not being able to account for other factors that may explain the relationship between race and non-voted ballots.
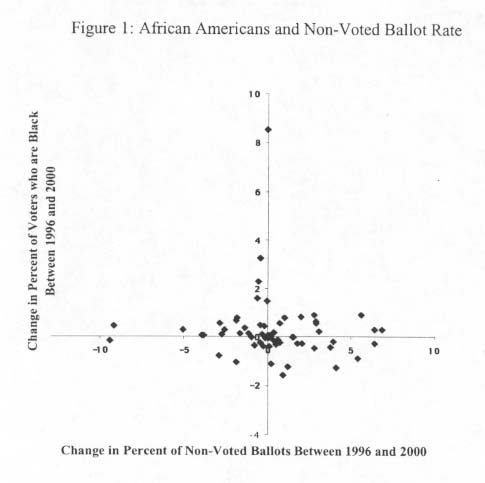
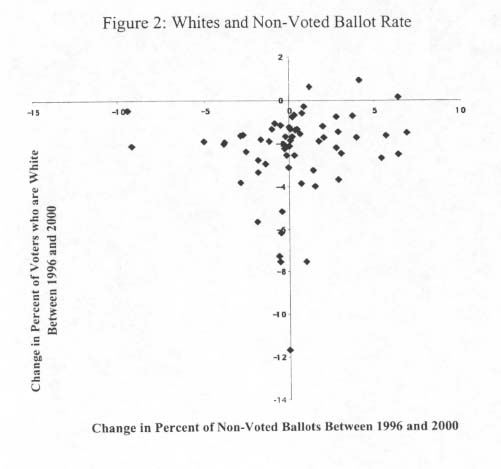
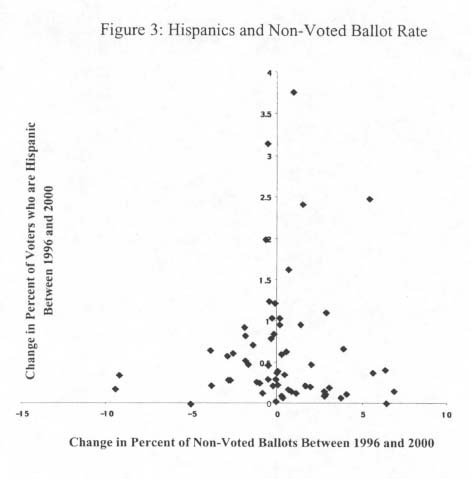
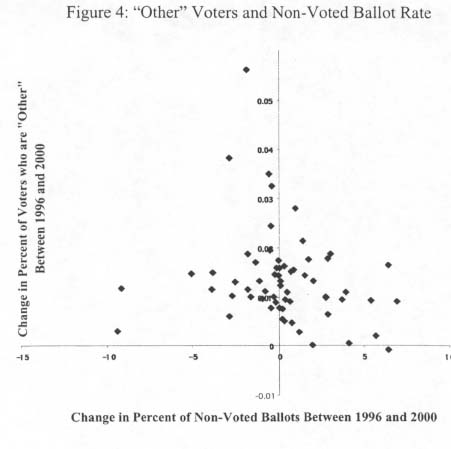
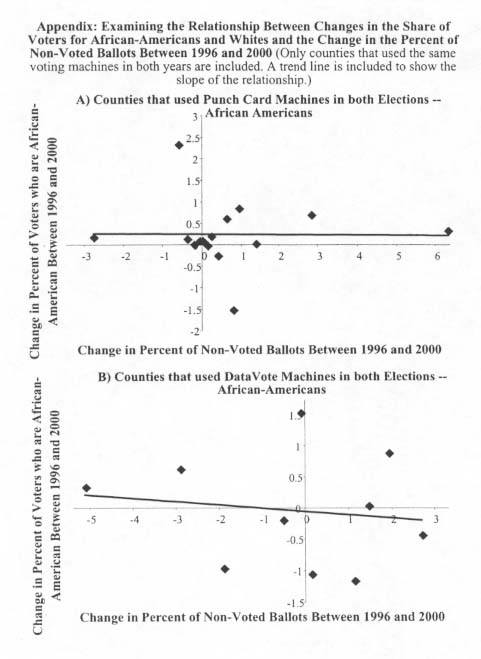
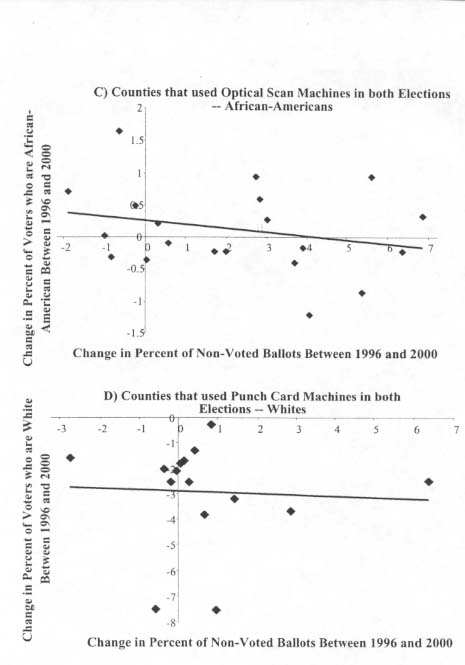
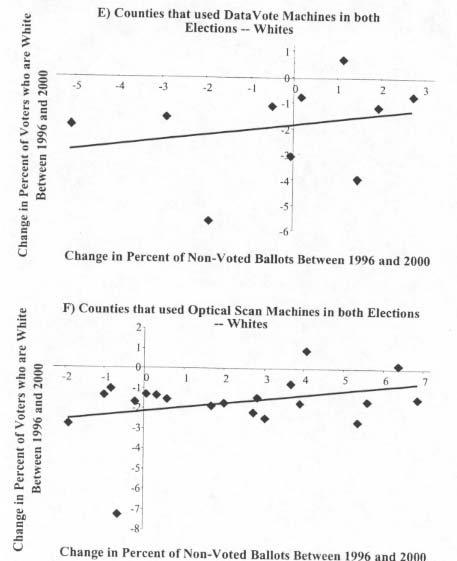
The simplest way to account for these other factors is to examine whether certain counties had high levels of non-voted ballots even before they had high levels of African-Americans. Thus, we examine counties over time and compare the change in the racial composition of voters with the change in non-voted ballots. If African-Americans disproportionately account for non-voted ballots, the percent of African-Americans and non-voted ballots should continue to hold across elections: counties with the largest increase in the percentage of voters who are African-American should also have the largest percentage increase in non-voted ballots.
To examine this, we compared the change in county ballot spoilage rates and racial composition in the Presidential election in the 1996 and 2000 and the change in the share of voters in those elections who were in different races. The results are shown in Figures I through 4. Generally it is difficult to see much of any relationship. If indeed there is one, it turns out to be the opposite of what is implied by the Majority Report: there is a very small negative correlation between increases in the percent of voters who are African-American and spoilage rates (a correlation of -4 percent). And an increase in the share of white voters is associated with an increase in the non-voted ballot rate, though none of these very simple relationships are statistically significant.4[4] Using data from the Election Data Services on the type of voting equipment used in different counties it is also possible to breakdown these figures on the basis of those counties that used the same voting machines in both the 1996 and 2000 elections. Doing so produces a set a graphs that is very similar to Figures I through 4 (see the Appendix).
III) Analyzing the Purely Cross-Sectional Level Data
Appendix I of the Commission's Majority Report lists the factors that they presumably tried to account for in their analysis of non-voted ballots. Besides the percent of registered voters who are African-American, they include information on the percent of the general population who are white, African-American, Hispanic, and minority; median income; the poverty rate; the type of voting system (optical, punch card, paper/hand, lever machine); and whether voting was tabulated at the precinct, centrally, or otherwise. While these factors are listed, there is surprisingly little discussion on why these factors rather than other variables are included. Despite repeated requests by commission member Abigail Thernstrom, no information has been provided on how exactly these different variables were included in their regression estimates.
The statistical appendix for the Majority Report provided by Allan Lichtman also mentions that the results are unaffected by including a variable measuring "the percentage of adults in the lowest literacy category failed to diminish the relationship between race and ballot rejection or to reduce the statistical significance of the relationship" from 1992.[5] While this "lowest literacy category" is not defined in the report, we assume that it is from the U.S. Department of Education's Adult Literacy Survey which defines it as those being unable to "make low-level inferences based on what they read and to compare or contrast information that can easily be found in [a] text. [6]
Why some of these factors are important is easy to explain. For example, measures of income and poverty are roughly associated with education and therefore with the ability to read and follow voting instructions. Literacy rates, as used by Lichtman, are a more direct measure of this, though even this is not perfect because the county data does not break down the rates by race. The national data indicates that 38 percent of African Americans - but only 14 percent of whites - ranked in the lowest category, so it does raise the issue of whether any race variables are proxying for left out literacy measures. Errors in voting can also vary with the type of voting equipment and possibly where the votes are tabulated. For example, if optical readers are used and the votes are fed into a vote counter directly by the voter, it is possible for a ballot with an error to be immediately returned to and corrected by the voter.
Other factors mentioned by the Commission in its appendix are more difficult to explain. For example, why include a detailed breakdown of the share of different groups in the general population but only examine the share of voters who are African-American? There is also the issue of what has been left out. Given the Majority Report's emphasis on "intentional discrimination" (e.g., p. 37), why not try to account for those involved in the process who might have some reason for either discriminating against African-American voters or preventing such discrimination? Some obvious controls for this are the political party affiliation or race of the county election supervisor. If the suspected discrimination is occurring against African-Americans and given that African-Americans vote so heavily for Democrats, it seems doubtful that Democratic or African-American election supervisors would act in ways to increase the rate of non-voted ballots of African-Americans.
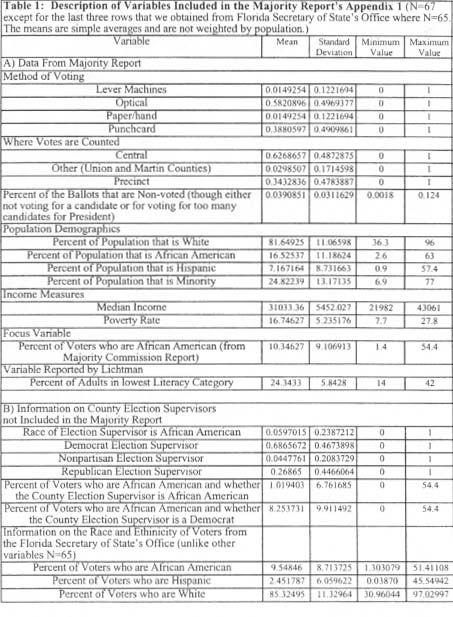
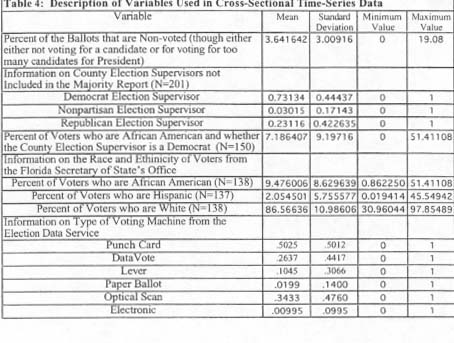
Because of these two sets of concerns, I gathered data on the share of voters who are white or Hispanic and on the political affiliation and race of county election supervisors from the Florida Secretary of State's Office and individual county supervisors of elections. Section A in Table I contains descriptive statistics on the county data for the year 2000 obtained directly from the Majority Report's Appendix 1. Section B in Table I provides information on the new variables that I obtained.
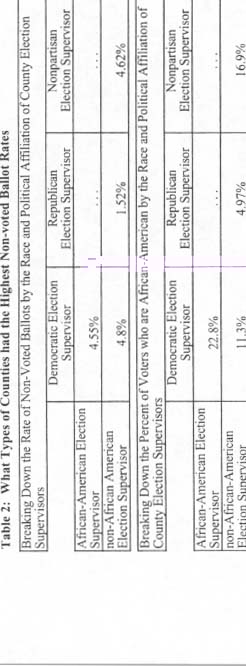
Table 2 provides some preliminary information using just the cross-sectional means that casts doubt on Republicans being responsible for the problems with non-voted ballots. Indeed, the counties with Democratic election supervisors have the highest non-voted ballot rate, with white Democrat supervisors having a higher rate than African-American Democrat supervisors. White Republican election supervisors have the lowest rate of spoiled ballots, indeed the simple means show that the non-voted ballot rate for white Republican supervisors is only a third of the rate of black Democratic supervisors. Comparing sections A and B in Table 2 also indicates why there is a simple correlation between race and non-voted ballots. Those counties with the highest rates of African-American voters also were more likely to have both Democratic supervisors and more spoiled ballots.
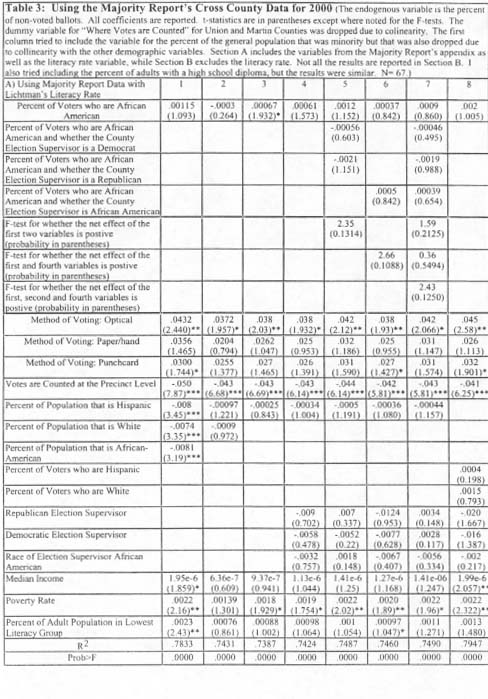
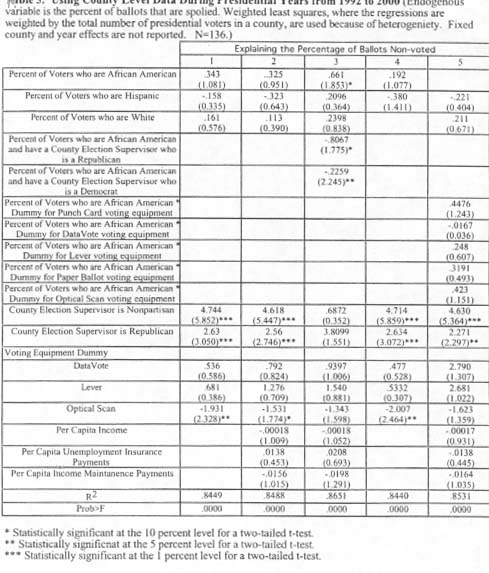
Since neither the Majority Report nor the accompanying "Draft Report" by Allan Lichtman show exactly what regressions specification they examined, I tried different specifications to replicate the commission's results. Because the Majority Report does not reference data on literacy rates, I report the results with and without the literacy variable included. However, it was difficult to find a consistent relationship between the share of voters who are African-American and the ballot spoilage rate. I started out by using all the variables reported in their Appendix I and the literacy rate (see column I in Table 3, section A). While the coefficient on the percent of voters who are African-American was indeed positive, implying that a greater share of voters being African-American (and not just characteristics correlated with the presence of African-Americans in the community) increased the spoilage rate, the coefficient was quite statistically insignificant. The probability that the coefficient was positive was only 28 percent. Excluding the literacy rate in Section B produced an even lower level of significance. Thus using the Commission's very own set of control variables, there is thus no real confidence that there is a positive relationship between the share of African-American voters and the ballot spoilage rate.
Because the cross-sectional data might not be sufficient to disentangle the share of African-Americans in the general population from the measure of the share of voters who are African-American, column 2 in Table 3 removes the variable for the share of African-Americans in the county population. Interestingly, this specification implies that a higher share of voters being African-American actually reduces the ballot spoilage rate. Indeed, it is quite damming that any specification that accounted for something as simple as the share of the county population that is white resulted in no significant relationship between the share of voters who are African-American and the ballot spoilage rate. The specification in column 3 removes the percentage of the population that is white and is the only specification shown in Table 3 when literacy rates are included that provide statistically significant evidence consistent with the Majority Report's claims.
Even in the specification (column 3) which implies a significant impact of the share of voters who are African-American, the variable explains very little of the overall variation in spoilage rates. Removing the share of voters who are African-American reduces the amount of variation in ballot spoilage that can be explained by the regression from 73.9 percent to 72.2 percent, a 2.3 percent reduction. By contrast, removing the variables that account for the method of voting and where the counting takes place explains 31 percent of the variation. In none of other the specifications shown in Table 3 does removing any or all of the variables that contain the share of voters who are African-American reduce the amount of the variation in non-voted ballots that can be explained by any more than 2 percent. In the first specification that uses all of the variables provided by the Majority Report, the share of voters who are African-American explains less than two-thirds of one percent of the variation.[7]
Once a specification that was consistent with the Majority Report's claims was identified, I examined whether the relationship between African-American and ballot spoilage rates might really be proxying for other left-out factors. The next four specifications (columns 4 through 7) point to one clear conclusion: there exist many other factors that occur in heavily African-American counties and any of these factors could generate a high non-voted ballot rate.
For example, the largest effect between the share of voters who are African-American and ballot spoilage rates exists when African-Americans are county election supervisors (column 6) and a net positive effect also occurs when Democrats are county election supervisors (column 5). Because the point estimates need to be added together in evaluating the impact of the percent of voters who are African-American in counties with African-American county election supervisors, the net effect in column 6 for the percent of voters who are African-American and that variable interacted with whether the county election supervisor is African-American is just short of being statistically significant at the 10 percent level (p=. 1088). The estimates imply that each one percent increase in the share of voters by African-Americans produces 135 percent more non-voted ballots when the county election supervisors are African-American than when they are of some other race.
The data does not allow us to distinguish which is the primary reason for the higher spoilage rate when African-American voters are relatively more prevalent, but the most statistically significant effect still appears to be whether African-Americans are voting in a county where the election supervisor is African-American. Column 7 implies that the rate of non-voting when there are more African-Americans in a county is 43 percent larger when the supervisor is African-American. If county level voting is rigged (intentionally or not) to discriminate against African-Americans voters, the empirical method used by the Majority Report implies that by far the most discriminatory counties are ones where Democrats and African-Americans control the balloting process. Unless we actually believe that Democrats and African-American officials are discriminating either intentionally or not against African-American voters (and such discrimination would make little sense), the obvious conclusion is that this approach for ferreting out discrimination is flawed.
By contrast, the estimates imply that in counties with Republican election supervisors a higher share of voters who are African-Americans actually results in a tiny reduction in the non-voted ballot rate, though the effect is never statistically significant. For each additional one percentage point of the voters living in a county with a Republican election supervisor, columns 5 and 7 imply that the non-voted ballot rate falls by between .09 and. I percentage points (a 6 to 7 percent decline in the average rate of non-voted ballots in counties with Republican supervisors).
I also tried another specification (not shown), similar to what is reported in the fourth column, that interacted the dummies for the four different types of voting machines and whether the ballots were counted centrally with the percent of voters who are African-American. Optical scans and punch card machines implied that more African-American voters resulted in more non-voted ballots, while lever machines and paper ballots implied relatively fewer non-voted ballots when there were more African-American voters, but none of the coefficients were statistically significant nor statistically significantly different from each other. Generally, since one would expect that the ability to discriminate against black voters should vary with the type of voting machine used, it is hard to see any relationship here that implies discrimination.
The other control variables imply that combining optical voting machines with the central counting of votes produces significantly more non-voted ballots, whereas optical votes counted at the precinct reduces spoilage. Higher poverty rates are also significantly associated with more spoilage in seven of the eight specifications, though median income is rarely statistically significant and then only when literacy rates are accounted for.
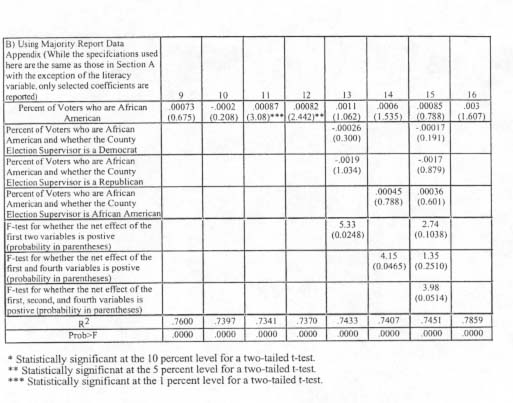
Section B of Table 3 reruns the regressions reported in Section A, but without the literacy rate variable. Lichtman's comments suggest his primary specifications did not include this variable.[8]
The general pattern of results is similar to what is shown in Section A, though the results are even stronger. Columns 13, 14, and 15 imply even more clearly that whatever relationship exists between a higher percentage of voters who are African-American and more non-voted ballots is driven by African-Americans living in counties with Democratic and/or African-American election supervisors. The net effects of the African-American voter interactions are always positive and the F-tests at the bottom of the section indicate that there is always at least one combination of these interactions that is statistically significant. By contrast, the net effect of Republican supervisors always implies that more African-American voters in those counties leads to fewer non-voted ballots.
Professor Lichtman's draft report, upon which the Majority bases it conclusions, makes the claim (p. 6) that: "is there some other factor which better explains this disparity in ballot rejection rates? In short the answer is no." This is indeed an important question. Yet, this section has shown that merely accounting for the data supplied in the Majority Report's appendix can reverse Lichtman's claim. In addition, this section has raised possible variables that help explain the variation in non-voted ballot rates that were never discussed in either the Majority Report or Lichtman's draft report.
There is a long list of other factors that might help explain spoilage rates, such as voter age or gender, and these were never included in the simple regressions. It is also important to study not only the means but the distributions of different variables. Part of our reason for not going much beyond what was done in the Majority Report was to keep our results as similar to theirs as possible, though it was very easy to include variables that would eliminate any statistical significance with respect to the share of voters who were African-American. The panel data set over several presidential elections in the following section examine these issues in more detail because the larger sample allows us to more fairly make this type of detailed breakdown.
IV) Analyzing the County Level Data for the 1992, 1996, and 2000 Presidential Elections
As noted earlier, using purely cross-sectional data faces severe limitations in accounting for differences across counties. There are many reasons for why spoilage rates differ and accounting for the fifteen variables used in our analysis (or the smaller number available in the Majority Report) leaves out many possible factors that are necessary to explain the difference in ballot spoilage rates in different counties. Using information on non-voted ballot rates during previous presidential elections allows us to examine whether changes in the racial composition of voters can explain changes in these rates. None of our results imply increasing the share of voters in any racial or ethnic group significantly increases non-voted ballot rates.
While neither the Florida Secretary of State's Office nor individual county election offices have detailed records on current county level voting operations, past information was not readily available on some variables, such as the method of voting, where the votes are tabulated, and the race of the county election supervisor.[9] Fortunately, Election Data Services provides data on the type of voting machine by county for the last three presidential elections.[10] During 1996 and 2000, fourteen counties switched from lever machines and eleven counties switched from DataVote machines. Most the changes for the 1996 election and all of those for 2000 were towards the adoption of optical scan machines.
In the regressions shown in Table 5, 1 use only the percent of the voters by race and not the demographic breakdown of the general population. In place of the median income and poverty rate, I use data that I had readily available on per capita income, per capita unemployment insurance payments, and per capita income maintenance payments (welfare).[11] These last three variables were only available up through 1998, so I use those values as proxies for the year 2000.[12] County fixed effects are used to account for other factors that explain differences in non-voted ballot rates across counties and fixed year effects are used to pick up differences over time. (The literacy rate data could not be included as it was only available for one year, and the fixed county effects would be perfectly collinear with this variable.)[13]
The results indicate that the percent of voters in different race or ethnic categories are rarely statistically related to ballot spoilage. In these specifications, less than 2 percent of the variation in non-voted ballots is explained by including African-American voters. The only specification that implies a statistically significant relationship between the rate of non-voted ballots and the percent of voters who are African-American is the third column, but even this result provides little support for the notion that discrimination was occurring. Because the percent of voters who are African-American in the third column is not only included by itself but also by interacting the African-American variable with whether the county election supervisor is a Republican or a Democrat, the interactions must be added together with the direct effect to determine the net effect of more African-American voters on the non-voted ballot rate in counties with Republican or Democratic supervisors. Doing this indicates that more African-American voters increases non-voted ballot rate when the election supervisors are either non-partisan or Democrats and decreases the non-voted ballot rate when they are Republicans. Each one percentage point increase in the percent of voters who are African-American results in the non-voted ballot rate rising by .43 percentage points when the election supervisor is a Democrat and falling by . 15 percentage points with a Republican. The net effects for Democratic or Republican supervisors are not statistically significantly different from zero nor from each other. The F-test for the difference between these the net impact on African-American voters in counties with Republican or Democratic supervisors is significant at only the 20 percent level. Only the direct effect of the percent of voters who are African-Americans is really statistically significant and that is picking up what is happening in counties run by non-partisan election supervisors.
The last specification replaces the simple variable for the percent of voters who are African-American with that variable being interacted with the dummy variables for the type of voting machines used. Interestingly, the coefficient on the interaction for punch card machines is almost identical to the interaction for optical scan machines, and F-tests indicate that none of the different voting methods imply a different rate of non-voted ballots as the percent of voters who are African-American increases.
As for the other variables, non-partisan and Republican county election supervisors are associated with more non-voted ballots. A county that switches from a Democratic to a non-partisan election supervisor sees its non-voted ballot rate more than double. Yet, while the average rates are higher for Republicans than Democrats, the non-voted ballot rate that does exist is more likely to be positively related to the share of voters who are African-American in Democratically controlled counties. The average non-voted ballot rate declined significantly from 1992 to 1996 and then rose very slightly in 2000. While the coefficients for optical scanners always imply a statistically significant lower rate of non-voted ballots, and three of the five coefficients are statistically significant. None of the other variables produce consistent results.
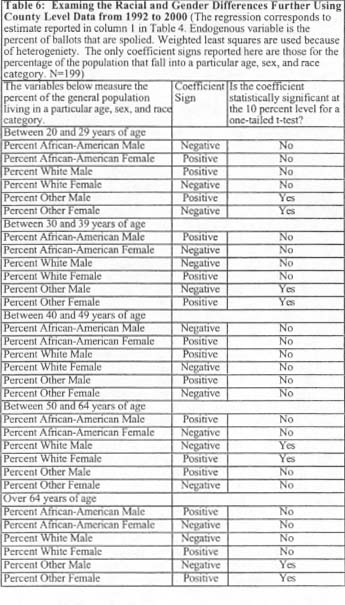
Table 6 replaces the voting share data in the first column of Table 5 with census demographic data to measure the differential impact that age, sex, and race might have on non-voted ballots.[14] This breakdown was not readily available in terms of those who voted in the elections, so I use the census data as a substitute. One reason for relying on this census data is that when the percent African-American in the general population are used in place of African-Americans as a share of voters the previous regressions, I obtain results that are roughly similar in size and statistical significance.
The results in Table 6 paint a much more complicated story on the relationship between race and non-voted ballots than is discussed by the Majority Report. For five age and sex categories, an increase in the share of voters who are African-American implies more non-voted ballots. Yet, for the other five age and sex categories, the reverse is true. It is not clear what form of discrimination would imply that more African-American males between 30 and 39 increases non-voted ballots, but the reverse is true for African-American females in that age range.
V) The Evidence on Excluding Convicted Felons
The evidence on convicted felons proves the opposite of what the Majority Report claims. In their conclusion on page 37, the Majority Report states that "the chance of being placed on this list [the exclusion list] in error is greater if the voter is African-American." The evidence they provide indicates that African-Americans had a greater share of successful appeals. However, since African-Americans also constituted an even greater share of the list to begin with, whites were actually the most likely to be erroneously on the list (a 9.9 percent error rate for whites [ 125/1264] versus only a 5.1 percent error rate for blacks [239/4678]). The rate for Hispanics (8.7 percent [105/1208]) is also higher than for blacks. Their own table thus proves the opposite of what they claim that it shows. A greater percentage of Whites and Hispanics who were placed on the disqualifying list were originally placed there in error.
In any case, this evidence has nothing to do with whether people were in the end improperly prevented from voting, and there is no evidence presented on that point. The Majority Report's evidence only examines those who successfully appealed and says nothing about how many people of those who didn't appeal could have successfully done so.
VI) Conclusion
It is difficult to see any evidence that African-Americans in Florida were systematically discriminated against in terms of voting. Even assuming that cross-sectional evidence is useful in evaluating this claim, it appears more consistent with indicating that the problem was worst in those counties where African-Americans were county election supervisors. It is difficult to reconcile that evidence with some notion that there was intent to disqualify African-American voters. The panel data makes it very difficult to ascertain any systematic bias either intentional or unintentional against African-American voters.
[1] U.S. Commission on Civil Rights, Voting Irregularities in Florida During the 2000 Presidential Election, June 8,2001 (/vote2000/stdraft1/main.htm).
[2] ibid.
[3] Abigail Thernstrom and Commissioner Russell G. Redenbaugh, The Florida Election Report:
Dissenting Statement, June 26, 2001 (http://www.manhattan-institute.org/html/final-dissent.htm).
[4] The correlation between the change in non-voted ballots and the share of voters who are white is .09; the same correlation for Hispanics is .03; and the correlation for "other" (neither white nor African American) is -.17.
[5] Allan J. Lichtman, "Report on the Racial Impact of the Rejection of Ballots Cast in the 2000 Presidential Election in the State of Florida," U.S. Commission on Civil Rights, June 2001 (/vote2000/stdraftl/ltrpt.htm).
[6] National Center for Education Statistics, Adult Literacy in America: A First Look at the Results of the National Adult-Literacy Survey, National Center for Education Statistics (Washington, D.C.: U.S. Government Printing Office, 1993), 18, 113.
[7] The claim in Professor Lichtman's draft report that 25 percent of the variation can be explained simply by the share of voters who are black is very misleading. It is obtained only because no other variables are included in that regression. This only makes sense if he really believes that this is the only variable that should be included in explaining the variation in ballot spoilage rates.
[8] Lichtman writes: "A multiple regression analysis that controlled for the percentage of high school graduates and the percentage of adults in the lowest literacy category failed to diminish the relationship between race and ballot rejection or to reduce the statistical significance of the relationship."
[9] Telephone calls were made to all the individual county election supervisor's offices in an attempt to obtain this data.
[10] Election Data Services is located at 1401 K Street, NW, Suite 500, Washington, DC 20005-3417.
[11] The data on these income and payment values were obtained from the Regional Economic Information System (REIS). Income maintenance includes Supplemental Security Insurance (SSI), Aid to Families with Dependent Children (AFDC), and food stamps.
[12] Lichtman uses a similar approach.
[13] As a proxy for new voters who may have made mistakes because they had no previously voted, I used a variable for the change in the number of voters by race from previous elections. This proxy has definite problems since an increase in the number of voters in a particular racial category can arise because of people who are experienced voters moving from one place to another. I found no significant impact from this variable. However, I was unable to determine whether this lack of statistical significance was due to there really not being a problem arising from new voters or from problems with the measure itself Including these variables did not alter the other findings.
[14] This data was obtained from the U.S. Bureau of the Census.