Appendix X
Supplemental Report on the Racial Impact of the Rejection of Ballots Cast in Florida's 2000 Presidential Election and in Response to the Statement of the Dissenting Commissioners and Report by Dr. John Lott Submitted to the United States Senate Committee on Rules in July 2001
Dr.
Allan J. Lichtman, Professor
Department of History
American University
Washington, DC 20016
August 2001
INTRODUCTION
This supplemental report provides additional evidence confirming the finding in my first report of wide disparities between ballot rejection rates for blacks and non-blacks in the presidential election of 2000 in Florida. It also examines issues raised in the statement of dissenting commissioners and the accompanying statistical report by Dr. John Lott submitted to the Senate Committee on Rules in late July of 2001.[1] In particular, this report comprehensively examines the question of whether other factors such as poverty, income, education, literacy, and first-time voting account for racial disparities in ballot rejection. The supplemental report demonstrates the following:
The finding in my initial report of major racial disparities in ballot rejection rates in Florida's 2000 presidential election is confirmed by additional evidence of what actually happened in voter precincts in three additional counties.
The dissenters statistical consultant admitted before the Senate Committee on Rules that a greater percentage of black and Hispanic people are turned away than, or don't get to vote, than white people. The dissenters concede that African Americans in Florida had their ballots rejected at a rate at least triple that of non-African Americans.
Racial disparities in ballot rejection rates cannot be explained by differences between blacks and non-blacks in education, income, or any other factor pointed to by the dissenters.
The relationship between race and ballot rejection remains substantial and statistically significant even within comprehensive models with much greater explanatory power than any of the models presented by dissenters.
Although the dissenters offer education and literacy as explanations for ballot rejection, the statistical models developed by their consultant do not show the importance of these variables. These models also exclude other key variables, include redundant variables, explain relatively little of the variation in ballot rejection among counties, and are contradicted by precinct-level results.
The dissenting opinion, which relies heavily on Dr. Lott's improperly designed and conducted statistical report, provides no credible discussion of the issues posed by the study of ballot rejection in Florida's presidential election.
1. THE FINDING OF MAJOR RACIAL DISPARITIES IN FLORIDA S 2000 PRESIDENTIAL ELECTION IS CONFIRMED BY ADDITIONAL EVIDENCE AND IS NOT CONTRADICTED BY ANY ALTERNATIVE FINDINGS
In my initial report I wrote, It should be stressed that the purpose of this study was to determine whether there existed in the Florida 2000 presidential election disparities between the ballot rejection rates of blacks and non-blacks. The purpose was not to establish the causes of any such disparities. The results of my analyses, both of county-level data and of precinct-level data within several counties, demonstrated that there were major differences in the rate of ballot rejection for blacks and non-blacks in Florida's 2000 presidential election. There is not a single alternative finding in the dissenting opinion or statistical report that even purports to show the lack of such race-linked disparities in ballot rejection. Indeed, the dissenters statistical consultant, John R. Lott, Jr., admitted the existence of such disparities in his testimony before the Senate Committee on Rules. The only numerical findings on the ballot rejection rates for African Americans and non-African Americans in either the dissenting opinion or the accompanying statistical report are numbers copied from my initial report. Thus the conclusions of my initial report stand without contradiction by any alternative results.
Since completing the original report I have gathered additional precinct-level data for Broward, Escambia, and Gadsden Counties.[2] These are important additions: Broward is the second most populous county in Florida. Escambia is a county with optical scanning technology recorded by precinct. Gadsden is the only majority-black county in Florida and had the highest ballot rejection rate in the state. In Broward County 14 percent of registered voters are black and 2.5 percent of ballots were rejected, slightly below the average for counties using punch card technology. In Escambia County 16 percent of registered voters are black and 3.6 percent of ballots were rejected, tied for second place among counties with optical scanning technology recorded by precinct. Escambia County had the largest number of rejected ballots (4372) for such counties, accounting for about a quarter of all rejected ballots for counties with optical scanning technology recorded by precinct. The analysis of Escambia County offers the first detailed glimpse using precinct-level data of the relationship between race and ballot rejection for counties with optical scanning technology recorded by precinct. It confirms the finding suggested in my first report of racial disparities in ballot rejection rates even among counties with the best available technology. In Gadsden County 54 percent of registered voters are black and 12.4 percent of ballots were rejected. The precinct-level data (for Broward, Duval, Escambia, Gadsden, Miami-Dade and Palm Beach Counties) now includes 59 percent of the statewide total of rejected ballots and 54 percent of the black registered voters in the state.
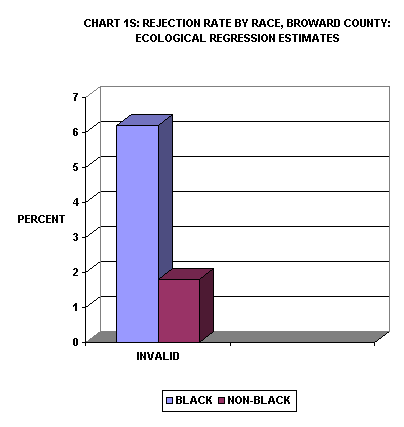
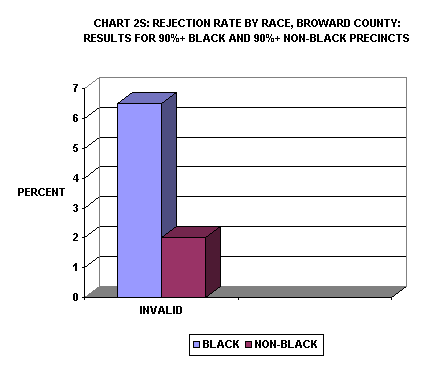
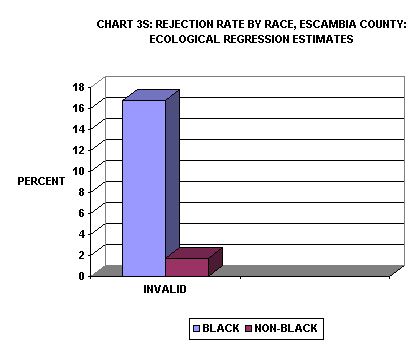
Precinct-by-precinct rejection rates and black voter percentages for Broward, Escambia, and Gadsden Counties are reported in Graphs 1S, 2S, and 3S (attached at the end of this report). These graphs also include the linear regression line to depict the relationship between race and ballot rejection. As indicated by the results of ecological regression and extreme case analysis reported in Table 1S and Charts 1S through 6S, the estimated rejection rates derived from precinct-level data in these three counties confirm the findings of the first report of major racial disparities in ballot rejection rates in Florida's 2000 presidential election.
For Broward County, as demonstrated in Table 1S and Chart 1S, the rate of rejection for ballots cast by blacks was an estimated 6.2 percent, compared to an estimated rate of 1.8 percent for votes cast by non-blacks. As demonstrated by Table 1S and Chart 2S, results of extreme case analysis for 90%+ black and non-black precincts confirm the findings of ecological regression analysis for Broward County. In precincts that were 90 percent or more black the overall rate of rejection was 6.5 percent, compared to a rate of 2.0 percent for precincts that were 90 percent or more non-black.
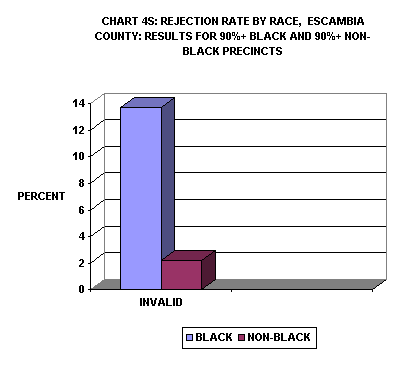
For Escambia County, as demonstrated in Table 1S and Chart 3S, the overall rate of rejection for votes cast by blacks was an estimated 16.8 percent, compared to a rate of 1.7 percent for votes cast by non-blacks. As demonstrated by Table 1S and Chart 4S, results of extreme case analysis for 90%+ black and non-black precincts confirm the findings of ecological regression analysis for Escambia County. In precincts that were 90 percent or more black the overall rate of rejection was 13.7 percent, compared to a rate of 2.2 percent for precincts that were 90 percent or more non-black.
The Escambia County results powerfully confirm race-related discrepancies in ballot rejection even among counties with the best available technology in Florida's 2000 presidential election. These results also sustain the conclusion that improved technology is not the complete answer to reducing rates of ballot rejection and diminishing race- related discrepancies. Press reports indicate that Escambia County might have turned off its precinct check on overvoting for reasons of economy, confirming the importance of resources and training. The findings for Escambia County reveal large, statistically significant differences in the rates of rejection for blacks and whites. The difference of 15 percentage points in estimated rates of ballot rejection for black and white voters exceeds the discrepancy of about 13 percent estimated from county-level data for all Florida counties, and is far greater than the discrepancy of about 4.5 percent estimated from county-level data for counties with optical scanning precinct-recorded technology.
| TABLE 1S: ECOLOGICAL REGRESSION AND EXTREME CASE RESULTS: BALLOT REJECTION RATES BY RACE, BROWARD ESCAMBIA, GADSDEN COUNTIES FLORIDA, 2000 PRESIDENTIAL ELECTION | |||
| BROWARD COUNTY: INVALID BALLOTS | |||
| ECOLOGICAL REGRESSION | EXTREME CASE ANALYSIS | ||
| BLACK VOTERS | NON-BLACK VOTERS | 90%+ BLACK PRECINCTS | 90%+ NON-BLACK PRECINCTS |
| 6.2% | 1.8% | 6.5% | 2.0% |
| ESCAMBIA COUNTY: INVALID BALLOTS | |||
| ECOLOGICAL REGRESSION | EXTREME CASE ANALYSIS | ||
| BLACK VOTERS | NON- BLACK VOTERS | 90%+ BLACK PRECINCTS | 90%+ NON-BLACK PRECINCTS |
| 16.8% | 1.7% | 13.7% | 2.2% |
| GADSDEN COUNTY: INVALID BALLOTS | |||
| ECOLOGICAL REGRESSION | EXTREME CASE ANALYSIS | ||
| BLACK VOTERS | NON- BLACK VOTER | 90%+ BLACK PRECINCTS | 90%+ NON-BLACK PRECINCTS |
| 21.6% | 4.4% | 22.8% | NA |
For Gadsden County, as demonstrated in Table 1S and Chart 5S, the overall rate of rejection for votes cast by blacks was an estimated 21.6 percent, compared to a rate of 4.4 percent for votes cast by non-blacks. The difference of 17 percentage points in estimated rates of ballot rejection between black and white voters is second only to Duval County among the six counties examined. As demonstrated by Table 1S and Chart 6S, results of extreme case analysis for 90%+ black precincts confirm the findings of ecological regression analysis for Gadsden County. In precincts that were 90 percent or more black the overall rate of rejection was 22.8 percent. There were no 90%+ non-black precincts in Gadsden County, although the two counties that were 88% non-black had rejection rates of 5.5 percent.
For all six counties examined with precinct-level results, the rate of rejected ballots by African Americans ranged from about 6.5 percent to about 24 percent. For all six counties, the unweighted mean rejection rate for ballots cast by blacks was 16.9 percent. In contrast, the ballot rejection rate for non-African Americans ranged from about 2 percent to 6 percent. The unweighted mean rejection rate for ballots cast by non-blacks was 3.7 percent, for a gap of 13.2 percentage points. For all six counties, the weighted mean rejection rate for ballots cast by blacks was 14.0 percent, meaning that nearly one of seven African Americans who entered the polling booth in these counties had their ballots rejected as invalid. The weighted mean rejection rate for non-blacks was 3.5 percent, for a gap of 10.5 percent. These results are comparable to the difference in ballot rejection rates of 12.8 percent for blacks and non-blacks statewide derived from the county-level ecological regression analysis of my first report. The racial divide of 10.5 percent net means that as compared to non-blacks 30,000 additional African Americans had their ballots rejected in these six counties alone. Statewide, a racial gap of 10.5 percent would mean that as compared to non-blacks, more than 60,000 additional African American voters had their ballots rejected in Florida's 2000 presidential election.
In response to the county-level and precinct-level findings in my initial report of major racial disparities in ballot rejection rates, the dissenters and their statistical expert present not a single alternative numerical estimate of the ballot rejection rate for African Americans in Florida's 2000 presidential election. The dissenters and their statistical consultants inexplicably fail to examine any of the precinct-level data that is available in Florida, even though such data provides crucial tests of county-level models and direct information on actual ballot rejection rates for overwhelmingly black and non-black precincts included within counties where purportedly the same voting technology was used in each precinct.
2. RACIAL DISPARITIES IN BALLOT REJECTION RATES CANNOT BE EXPLAINED BY DIFFERENCES BETWEEN BLACKS AND NON-BLACKS IN EDUCATION, LITERACY, INCOME, POVERTY OR ANY OTHER FACTOR CITED BY DISSENTERS
The only statistical analysis presented by dissenters is in their accompanying statistical report prepared by John R. Lott. However, Lott's report ignores the central issues of racial disparities in ballot rejection for Florida's 2000 presidential election. Instead it addresses the separate issue of whether such disparities can be attributed to other factors. The analyses presented below will demonstrate that differences in literacy, education, income, or poverty do not account for the major differences in ballot rejection rates for African Americans and non-African Americans in the presidential election of 2000. The relationship between race and ballot rejection remains substantial and statistically significant even after controlling for such variables as well as for many other factors, including measurements of first-time voting.
Table 2S below reports a county-level multiple regression analysis that, unlike the statistical report presented by dissenters, controls directly for literacy, education, poverty, and income for all counties. In addition, these equations also control for differences in technology: whether a county uses punch cards, optical scanning centrally recorded, or paper ballots or machines. The influence of these technological variables is measured against the remaining system used in Florida: optical scanning by precinct. An additional analysis, presented in Table 3S, examines the issue of the influence of education and first-time voting on ballot rejection rates for precincts within Miami-Dade County.[3]
The county-level findings reported in Table 2S show that racial differences in ballot rejection rates in the 2000 presidential election are not reducible to differences between blacks and non-blacks in income, poverty, education, or literacy. To the contrary, as indicated by the preliminary analysis presented in my initial report, controlling for socio-economic factors fails to diminish the relationship between race and ballot rejection or to reduce the statistical significance of the relationship. As demonstrated in Table 2S, even after controlling for a wider array of socio-economic variables than any of the dissenters models, the relationship between race and ballot rejection remains substantial and statistically significant at levels beyond the stringent .01 standard used in social science.[4] The regression coefficient for the percentage of black voters, controlling for all variables in Table 2S, is .140, which corresponds to a difference in ballot rejection of 14.0 percentage points between blacks and non-blacks, holding constant the variables included in the equation. This means that independent of income, poverty rates, education, literacy, and the technology for voting, there is a double-digit difference in ballot rejection rates between African Americans and non-African Americans. This result is comparable to the difference in ballot rejection rates of 12.8 percent for blacks and non-blacks derived from the ecological regression analysis of my first report.[5]
|
TABLE 2S: THE INFLUENCE OF RACE ON BALLOT REJECTION RATES 2000 PRESIDENTIAL ELECTION IN FLORIDA, CONTROLLING FOR LITERACY, EDUCATION, INCOME, AND POVERTY, COUNTY DATA |
|||
|
VARIABLE |
REG. COEFF. |
T VALUE |
SIGNIF. |
|
BLACK VOTERS |
.140 |
4.2 |
.000 |
|
POVERTY PERSONS 18+ |
-.047 |
-.644 |
.522 |
|
MEDIAN INCOME |
-.00009 |
-.1.24 |
.220 |
|
LITERACY |
-.077 |
-1.14 |
.261 |
|
% UNDER 9TH GRADE |
.192 |
2.65 |
.010 |
|
PUNCH CARD |
3.20 |
6.81 |
.000 |
|
OPTICAL CENTRAL |
4.42 |
7.70 |
.000 |
|
PAPER/LEVER |
3.02 |
2.65 |
.011 |
|
R2 = .805 |
|||
The findings of an analysis of precinct-level data from Miami-Dade County, reported in Table 3S, confirms that the relationship between race and ballot rejection is independent of educational levels. In Miami-Dade County, which includes numerous black and Hispanic voters, a greater percentage of Hispanics than African Americans had less than a ninth grade education the only socio-economic variable that was statistically significant in the analysis reported in Table 2S above. The percentages are 27 percent for Hispanics and 18 percent for African Americans. Moreover, Hispanics face additional language barriers to voting. If education were responsible for differences in ballot rejection, the Hispanic rate of ballot rejection in Miami-Dade County should be comparable to or even greater than the black rate. As demonstrated in my initial report, these expectations are not confirmed. The heavily African American precincts have a much higher rejection rate than the heavily non-African American precincts. However, the heavily Hispanic precincts have a lower rejection rate than the heavily non-Hispanic precincts (many of which are African American).
|
TABLE 3S: ECOLOGICAL REGRESSION RESULTS: BALLOT REJECTION RATES FOR BLACKS AND HISPANICS, FLORIDA 2000 PRESIDENTIAL ELECTION MIAMI-DADE COUNTY |
|||
INVALID VOTES |
|||
|
BLACK VOTERS |
HISPANIC VOTERS
|
WHITE VOTERS |
|
|
10.0% |
4.2% |
1.7% |
|
|
TABLE 4S: THE INFLUENCE OF RACE ON BALLOT REJECTION RATES 2000 PRESIDENTIAL ELECTION IN FLORIDA, CONTROLLING FOR RACE AND 17 20-YEAR-OLD REGISTRANTS, MIAMI-DADE COUNTY |
|||
INVALID VOTES |
|||
|
VARIABLE |
REG. COEFF. |
T VALUE |
SIGNIF. |
|
PERCENT BLACK VOTERS |
.093 |
21.6 |
.000 |
|
PERCENT HISPANIC VOTERS |
.027 |
6.2 |
.000 |
|
PERCENT 17-20 |
-.202 |
-4.0 |
.000 |
Table 3S provides a more refined analysis of the influence of race and ethnicity on ballot rejection in Miami-Dade County. It reports the results of a multiple regression analysis, based on precinct-level data, which estimates the percentages of rejected ballots of African American, Hispanic, and white voters in each precinct. The results of analysis shows that the black rejection rate is substantially higher not only than the white rate but also than the Hispanic rate as well. The rejection rate for whites is only 1.7 percent. The Hispanic rate is higher at 4.2 percent, whereas the African American rate is 10.0 percent, almost 6 percentage points higher than the Hispanic rate and more than 8 percentage points higher than the white rate.
The data available in Miami-Dade County also provides an opportunity to extend the regression model to include a measure that in part captures the phenomenon of first-time voting: the percentage of registrants aged 17 to 20. Virtually all of those voting from this group will be first-time voters in 2000, although, of course, first-time voters could also belong to other age groups. The results of analysis, reported in Table 4S, show that when controlling for race, the coefficient for the percentage of 17- to 20-year-old registrants is negative. In contrast, the coefficient for black voters is positive, substantial, and statistically significant, indicating a 9.3 percentage point gap between black and white rejection rates, controlling for first-time registrants. The coefficient for Hispanics reveals a smaller, but still statistically significant gap of 2.7 percentage points.
In sum, the results of analyses at both the county-level and precinct-level decisively reject the proposition asserted but never fully tested by the dissenters that differences between African American and non-African American rates of ballot rejection are a function of socio-economic factors. To the contrary, racial differentials in ballot rejection rates are virtually unaffected by controls for literacy, education, income, and poverty. Moreover, at least a partial control for first-time voting, using precinct-level data from Dade County shows no influence on the relationship between race and ballot rejection.
3. THE RELATIONSHIP BETWEEN RACE AND BALLOT REJECTION REMAINS SUBSTANTIAL AND STATISTICALLY SIGNIFICANT EVEN WITHIN COMPREHENSIVE MODELS WITH FAR GREATER EXPLANATORY POWER THAN ANY MODELS PRESENTED BY THE DISSENTERS
The results of estimating a more comprehensive model of ballot rejection in Florida counties than that presented in Table 2S is reported in Table 5S. This model surpasses the effort to control for socio-economic factors by also including the increase in the vote cast between the elections of 1996 and 2000, the turnout of registered voters in 2000, the percentage of the presidential vote received by the Democratic candidate, the ratio of voters to precincts in each county, and whether the election supervisor is Republican or Democratic.
This model does a far better job than any of the models in the dissenters statistical supplement in accounting for changes from county to county in the percentage of rejected ballots in Florida's 2000 presidential election. With an R2 value of .866, this model accounts for 86.6 percent of the variation from county to county in ballot rejection rates for the 2000 presidential election. The models in the dissenters statistical report (Table 2) explain only from 73.4 percent to 79.5 percent of the variation from county to county in ballot rejection rates for the 2000 presidential election.
|
TABLE 5S: THE INFLUENCE OF RACE ON BALLOT REJECTION RATES 2000 PRESIDENTIAL ELECTION IN FLORIDA, COUNTY DATA |
|||
|
VARIABLE |
REG. COEFF. |
T VALUE |
SIGNIF. |
|
BLACK VOTERS |
.143 |
4.77 |
.000 |
|
POVERTY PERSONS 18+ |
-.014 |
-.218 |
.828 |
|
MEDIAN INCOME |
-.00002 |
-.229 |
.820 |
|
LITERACY |
-.0003 |
-.002 |
.998 |
|
% UNDER 9TH GRADE |
.012 |
.158 |
.875 |
|
INCREASE VOTE 96-2000 |
-.014 |
-.638 |
.526 |
|
TURNOUT 2000 |
-.075 |
-2.42 |
.019 |
|
PERCENT DEM. |
-.049 |
-2.01 |
.050 |
|
VOTERS PER PRECINCT |
-.002 |
-2.78 |
.008 |
|
DEM SUPERVISOR |
-.345 |
-.466 |
.686 |
|
REP SUPERVISOR |
-.317 |
-.406 |
.643 |
|
PUNCH CARD |
3.46 |
8.09 |
.000 |
|
OPTICAL CENTRAL |
4.31 |
8.18 |
.000 |
|
PAPER/LEVER |
2.35 |
2.30 |
.026 |
|
R2 = .866 |
|||
Despite the stringent controls included in this model, the relationship between race and ballot rejection is substantial and statistically significant at levels beyond the stringent .01 standard used in social science. The regression coefficient for the percentage of black voters, reported in Table 5S, is .143, which corresponds to a difference in ballot rejection of 14.3 percentage points between blacks and non-blacks, controlling for the variables in the equation. This coefficient value is almost identical to the coefficient reported above without the additional variables.[6] None of the socio-economic variables in this comprehensive model, however, have a statistically significant influence on ballot rejection rates. Neither does the variable measuring changes in voter turnout between 1996 and 2000, a variable that would partly capture the phenomenon of first-time voting.
Similarly, the political identity of election supervisors has no discernible influence on ballot rejection rates in the comprehensive model. Variables measuring whether the supervisor is Republican or Democrat both have negative signs (relative to non-partisan supervisors), and fail to approach conventional levels of statistical significance. In contrast, controlling for the factors included in the equations of Table 5S, the relationship between ballot rejection rates and the Democratic vote in the 2000 presidential election is negative and statistically significant at .05. This indicates that as Gore strength declines, ballot rejection rates are higher than would be expected based on the other variables in the model.
The findings of this study that the relationship between race and ballot rejection remains substantial and statistically significant even under stringent controls is confirmed by other independent analyses, including one performed by Philip A. Klinkner, Associate Professor of Political Science of Hamilton College, and submitted to the United States Senate Committee on Rules.[7] All his models explain far more variation than any of the models in the statistical report presented by the dissenters. Professor Klinkner found that for every model studied, the relationship between the percentage of black registered voters and the percentage of rejected ballots remained substantial and statistically significant. Professor Klinkner concludes, While my data and findings were arrived at independently, these findings are essentially the same as those of the U.S. Commission on Civil Rights (USCCR). Thus, my data and findings contradict the accusations that the USCCR conducted a biased survey with inaccessible data. [8]
Based on an analysis of Florida's individual voter files for 2000, Professor Klinkner has also provided county-by-county percentages of first-time voters.[9] Results reported in Table 6S demonstrate that substituting this direct measure of first-time voting into the model for change in voting between 1996 and 2000 produces virtually no change in the relationship between race and ballot rejection.[10] According to Table 6S, the coefficient for the percentage of black voters is statistically significant beyond conventional levels and has a value of .137, corresponding to a difference in ballot rejection of 13.7 percentage points between blacks and non-blacks, controlling for the variables in the equation. The coefficient measuring the relationship between first-time voting and ballot rejection is negative and falls far short of statistical significance. None of the other variables from Table 5S show any substantial change in Table 6S. The model in Table 6S also explains 87.4 percent of the variance in rejection rates, far greater than any of the models presented by Dr. Lott. Thus the hypotheses presented by the dissenters regarding the alleged effects of income, poverty, education, literacy, or first-time voting do not withstand scrutiny. The inclusion of these variables in an analysis estimating ballot rejection rates does not diminish the relationship between race and ballot rejection in Florida counties for the 2000 presidential election.
4. THE STATISTICAL REPORT PRESENTED BY DISSENTERS PROVIDES NO CREDIBLE MODELS OF BALLOT REJECTION IN FLORIDA S 2000 PRESIDENTIAL ELECTION
The statistical report commissioned by dissenters includes only one table that provides the results of estimating models of ballot rejection in the presidential election of 2000. These estimates, which are for county-level data, are in Table 3 of the dissenters statistical report, which includes 16 models. The results of Models 1 through 8, which include the literacy variable, are fully reported in Table 3. The results of Models 9 through 16, which do not include literacy, are only partially reported in Table 3. These models are nearly, but not quite identical, to the 8 models presented in Dr. Lott's original report. Dr. Lott's models, at a minimum, suffer from the following flaws:
The dissenters models lack conceptual foundation. Among other problems they omit key variables that are essential to hypotheses advanced in the dissenters written opinion, including measures of education and first-time voting.
The dissenters models include duplicative measures of the racial composition of county, destroying the integrity of the effort to gauge the independent influence of race on ballot rejection rates.
The dissenters models explain far less of the variation in ballot rejection than the models developed by Professor Klinkner and myself.
The dissenters models produce results that are internally contradictory and conflict with what we actually know happened at the precinct level in Florida's 2000 presidential election.
The dissenting opinion as opposed to the statistical report in both its initial and revised form cited education, literacy, and first-time voting as the key explanatory factors accounting for the relationship between race and ballot rejection in Florida's 2000 presidential election (see pp. 21 24). Despite this emphasis on education, literacy, and first-time voting, of the 8 statistical models of ballot rejection in the 2000 presidential election in Dr. Lott's initial report, not a single model included variables measuring education, literacy, or first-time voting. He does not explain his exclusion of education and first-time voting, but does attempt to justify his omission of literacy by claiming that my initial report does not reference data on literacy rates. (Lott report, p. 4). Yet in my initial report I fully defined my literacy variable, precisely reported its source, and provided printouts of the data for each of the 67 Florida counties. I provided the same information for my use of educational data. Indeed, the dissenters own report, as distinct from Dr. Lott's statistical supplement, includes an extensive discussion of my use of literacy data. In the current revision of his report, Dr. Lott somehow discovers the literacy data and includes it in an additional eight models that he presents in his revised report.
|
TABLE 6S: THE INFLUENCE OF RACE ON BALLOT REJECTION RATES 2000 PRESIDENTIAL ELECTION IN FLORIDA, COUNTY DATA |
|||
|
VARIABLE |
REG. COEFF. |
T VALUE |
SIGNIF. |
|
BLACK VOTERS |
.137 |
4.56 |
.000 |
|
POVERTY PERSONS 18+ |
.011 |
.167 |
.868 |
|
MEDIAN INCOME |
.00001 |
.149 |
.882 |
|
LITERACY |
-.009 |
-.142 |
.887 |
|
% UNDER 9TH GRADE |
.024 |
.326 |
.746 |
|
% FIRST-TIME VOTERS |
-.015 |
-.319 |
.751 |
|
TURNOUT 2000 |
-.071 |
-2.50 |
.016 |
|
PERCENT DEM. |
-.047 |
-1.98 |
.054 |
|
VOTERS PER PRECINCT |
-.002 |
-2.20 |
.033 |
|
DEM SUPERVISOR |
-.452 |
-.637 |
.527 |
|
REP SUPERVISOR |
-.475 |
-.640 |
.525 |
|
PUNCH CARD |
3.32 |
8.27 |
.000 |
|
OPTICAL CENTRAL |
4.47 |
8.94 |
.000 |
|
PAPER/LEVER |
2.32 |
2.24 |
.030 |
|
R2 = .874 |
|
|
|
Dr. Lott's new results decisively reject the thesis that literacy accounts in significant part for racial disparities in ballot rejection rates in Florida's 2000 presidential election. In 7 of Dr. Lott's 8 new models literacy does not have a statistically significant influence on ballot rejection, even using the lenient .1 standard that Dr. Lott employs in his report.[11] One out of 8 statistically significant results (Model 1) is about what would be expected by chance or random factors alone. Dr. Lott claims that literacy also has a statistically significant influence (at the .1 level) in another model Model 6. However, this claim is mistaken. The t-statistic for the literacy variable in his Model 6 is only 1.047, well below the level needed for statistical significance even at the .1 level. In the same model 6, the t-statistic for the median income variable is 1.27, which Dr. Lott correctly does not identify as statistically significant at even the .1 level. Dr. Lott's models, which have now grown to 16 in his revised report, still exclude education and first-time voting despite the importance of these variables to the dissenters arguments.[12]
These crucial omissions are but one indication that Dr. Lott's statistical models lack conceptual foundation. Among other problems, the models include redundant racial variables, thereby producing misleading results. Why would the dissenters statistical models exclude the variables that dissenters affirm to be most relevant while as will be shown below including redundant variables that provide no new information, but only cancel each other's effects? One can only speculate that the dissenters might have been less interested in accurately modeling the ballot rejection process in Florida and more interested in coming up with models however invalid that at least appeared to minimize and obscure the independent influence of race on ballot rejection in Florida's 2000 presidential election.
Table 7S and 8S reproduce the variables used in the dissenters statistical report. The tables indicate which variables are included in each of the 16 models of ballot rejection in Florida's 2000 presidential election presented in Table 3 of Lott's report. A notation of Y indicates that the variable is included in the model; a notation of N indicates that the variable is not included. Table 7S reports results for the first 8 models in his report: the models to which he has now added the literacy variable. Table 8S reports results for models labeled 9 through 16 in his report, which are the initial models that did not include the literacy variables, but are otherwise identical to models 1 through 8. Dr. Lott did choose to report coefficient values for all variables included in Models 9-16. Thus Table 8S includes only variables for which Dr. Lott provides results in his revised report. Table 7S and 8S also report the R2 value for each model and the sign and statistical significance of the coefficients estimated for each variable in each model. For the percentage of black voters, Tables 7S and 8S duplicate the coefficient value and its statistical significance as reported in Table 3 of the dissenters statistical report. All 16 models are based on county-level data, with no attempt to check their credibility with precinct-level data within counties a critical omission as will be demonstrated below.
|
TABLE 7S: MODELS 1 8 OF BALLOT REJECTION IN THE 2000 FLORIDA PRESIDENTIAL ELECTION: STATISTICAL REPORT OF DISSENTERS, TABLE 3 |
||||||||
|
VARIABLE |
1 |
2 |
3 |
4 |
5 |
6 |
7 |
8 |
|
% BLACK VOTERS |
Y .00115 |
Y -.0002 |
Y .00067* |
Y .00061 |
N .0012 |
N .00037 |
Y .0009 |
Y .002 |
|
% BLACK VOTERS & ELEC SUP = DEM |
N |
N |
N |
N |
Y (-)
|
N |
Y (-) |
N |
|
% BLACK VOTERS & ELEC SUP = REP |
N |
N |
N |
N |
Y (-) |
N |
Y (-)
|
N |
|
% BLACK VOTERS & ELEC SUP = BLACK |
N |
N |
N |
N |
N |
Y (+)
|
Y (+) |
N |
|
OPTICAL SCANNING |
Y (+) * |
Y (+) * |
Y (+ ) *
|
Y (+) * |
Y (+)*
|
Y(+) *
|
Y(+) *
|
Y (+) * |
|
PAPER/HAND |
Y (+) + |
Y (+) + |
Y (+) + |
Y (+) + |
Y (+) + |
Y (+) + |
Y (+) + |
Y (+) + |
|
PUNCH |
Y (+) * + |
Y (+) + |
Y (+) + |
Y (+) + |
Y (+) + |
Y (+) * + |
Y (+) + |
Y (+) * + |
|
PRECINCT SCANNING |
Y (-) *
|
Y (-) *
|
Y (-) * |
Y (-) * |
Y (-) * |
Y (-) * |
Y (-) * |
Y (-) * |
|
% HISPANIC POPULATION |
Y (-) *
|
Y (-) |
Y (-)
|
Y (-) |
Y (-)
|
Y (-) |
Y (-)
|
N |
|
% WHITE POPULATION |
Y (-) * - * |
Y (-) - |
N |
N |
N |
N |
N |
N |
|
% BLACK POPULATION |
Y (-) * - * |
N |
N |
N |
N |
N |
N |
N |
|
% HISPANIC VOTERS |
N |
N |
N |
N |
N |
N |
N |
Y (+) + |
|
% WHITE VOTERS |
N |
N |
N |
N |
N |
N |
N |
Y (+) + |
|
ELECTION SUP REP |
|
|
|
Y (-) - |
Y (+) - |
Y (-) - |
Y (+) - |
Y (-) - |
|
ELECTION SUP DEM |
|
|
|
Y (-) - |
Y (-) - |
Y (-) - |
Y (+) - |
Y (-) - |
|
ELECTION SUP BLACK |
|
|
|
Y (-) - |
Y (+) |
Y (-) - |
Y (-) - |
Y (-) - |
|
MEDIAN INCOME |
Y (+) * + |
Y (+) + |
Y (+) + |
Y (+) + |
Y (+) + |
Y (+) + |
Y (+) + |
Y (+) * + |
|
POVERTY |
Y (+) * + |
Y (+) + |
Y (+) * + |
Y (+) * + |
Y (+) * + |
Y (+) * + |
Y (+) * + |
Y (+) * + |
|
LITERACY |
Y (+) * + |
Y (+) + |
Y (+) + |
Y (+) + |
Y (+) + |
Y (+) * + |
Y (+) + |
Y (+) + |
|
R2 |
.783 |
.743 |
.739 |
.742 |
.749 |
.746 |
.749 |
.795 |
|
* INDICATES THAT COEFFICIENT IS IDENTIFIED AS STATISTICALLY SIGNIFICANT IN TABLE 2 OF DISSENTERS STATISTICAL REPORT. |
||||||||
|
TABLE 8S: MODELS 9 16 OF BALLOT REJECTION IN THE 2000 FLORIDA PRESIDENTIAL ELECTION: STATISTICAL REPORT OF DISSENTERS, TABLE 3: |
||||||||
|
VARIABLE |
9 |
10 |
11 |
12 |
13 |
14 |
15 |
16 |
|
% BLACK VOTERS |
Y .00073 |
Y -.0002 |
Y .00087* |
Y .00082* |
N .0006 |
N .00085 |
Y .0009 |
Y .003 |
|
% BLACK VOTERS & ELEC SUP = DEM |
N |
N |
N |
N |
Y (-)
|
N |
Y (-) |
N |
|
% BLACK VOTERS & ELEC SUP = REP |
N |
N |
N |
N |
Y (-)
|
N |
Y (-)
|
N |
|
% BLACK VOTERS & ELEC SUP = BLACK |
N |
N |
N |
N |
N |
Y (+)
|
Y (+) |
N |
|
R2 |
.760 |
.740 |
.730 |
.737 |
.743 |
.741 |
.745 |
.786 |
|
* INDICATES THAT COEFFICIENT IS IDENTIFIED AS STATISTICALLY SIGNIFICANT IN TABLE 2 OF DISSENTERS STATISTICAL REPORT. |
||||||||
We will consider first Models 2 and 10 from the dissenters statistical report the only models that purport to show a negative relationship between race and ballot rejection, controlling for other variables although the relationship is small and lacking in statistical significance. The two models, which are identical except for the inclusion of literacy in Model 2, fail to accurately represent the relationship between race and ballot rejection. The models are fundamentally flawed in design, failing to test the dissenters hypotheses on the influence of education and first-time voting on ballot rejection rates. The only explanatory variables included in the model beyond voting technology and race are median income, poverty, and literacy none of which is found to have a statistically significant relationship to ballot rejection even at the lenient .1 standard used in the dissenters statistical report. Models 2 and 10 also lack explanatory power. As indicated by the R2 value of .743 for Model 2 and .740 for Model 10, the models explain only 74.3 and 74.0 percent of the county-to-county variance in ballot rejection rates, as compared to the much larger 86.6 percent for the model presented in Table 5S above and 87.4 percent for the model presented in Table 6S above. It should also be noted that Dr. Lott's addition of the literacy variable to Model 2 as compared to Model 10 increases the explanatory power of the model by a miniscule .3 percent.
Dissenters Models 2 and 10 also include redundant racial variables that destroy the integrity of the effort to gauge the independent relationship between race and ballot rejection. An elementary rule of statistical analysis is to avoid duplicative variables that are nearly perfectly correlated with one another, either positively or negatively. Such redundancy among variables ( multicollinearity ) produces inaccurate statistical estimates, even incorrectly representing the relationship between an explanatory variable and the dependent variable in the model (e.g., between race and ballot rejection). Even beginner-level statistical texts warn about the highly misleading effects of extreme multicollinearity among variables. Sanford Weisberg, for example, writes that as a result of multicollinearity estimated effects can change magnitude or even sign. Eric A. Hanushek and John E. Jackson observed that high correlations among the exogenous variables lead to imprecise coefficient estimates. These results of multicollinearity can seriously handicap our ability to make inferences about individual coefficients. [13]
The multicollinearity in Model 2 is extreme, edging perilously close to the mathematical maximum, thereby making it impossible to reliably interpret the coefficients for racial variables included in the model. The model includes both the percentage of blacks among registered voters and the percentage of Hispanics and whites in the population, variables that are almost perfect mirror images of one another, with a squared correlation of about .90, approaching the mathematical maximum of 1.0, which occurs when you have two identical variables. Not surprisingly, with such duplicative variables, the model yields absurd results, with a negative sign for blacks, Hispanics and whites, suggesting nonsensically that membership in all three groups reduce ballot rejection rates.
It is also crucial in assessing the credibility of Models 2 and 10 that the only statistically significant results in the models are for variables measuring differences in the voting technologies across counties. Thus within counties, where the technology is the same, the model predicts random variation or perhaps even a slightly negative tilt in the relationship between the percentage of blacks among voters and the percentage of rejected ballots. This theorizing by the dissenters is contradicted by what we know actually happened in Florida's voting precincts. The precinct-level data ignored by dissenters demonstrates a powerful, positive statistically significant relationship between the percentage of black voters and the percentage of rejected ballots, with differences between black and non-black rejection rates that range as high as 18 percentage points.[14] Thus, the model is invalidated by its own internal contradictions and by its manifestly false predictions of the within-county relationship between race and ballot rejection. Rarely in social science is a statistical model so decisively rejected by its own predictive results.
Table 9S below replicates Models 2 and 10, including controls for technology, median income, poverty, and literacy for Model 2, and technology, median income, and poverty for Model 10, but eliminating the redundant racial variables.[15] Remarkably, these clearer and conceptually grounded models actually explain a greater amount of the county-to-county variance than the models developed in the dissenters statistical report. This suggests that there may have been errors in the data and model estimation in the report prepared by the dissenters statistical consultant.[16] The non-redundant, more powerful model reveals a greater than 11 percentage point difference in ballot rejection rates for black and non-black voters, a relationship that is statistically significant at levels well beyond the stringent .01 standard.
Other models included in the dissenters statistical report exhibit problems similar to those of Model 2. Models 1 and 9, which show a positive relationship between black voters and ballot rejection, but a lack of statistical significance, also include redundant racial variables.
Ironically, Models 3 and 11 in the dissenters statistical report, where redundant demographic variables are eliminated and only measures of the percentage of African Americans and Hispanics are included, both show a positive, substantial, and statistically significant relationship between the percentage of black registered voters in a county and the percentage of rejected ballots, controlling for all other variables in the models.
Models 4 and 12 in Dr. Lott's statistical report add three new variables: whether the county election supervisor is Democratic, whether the supervisor is Republican, and whether the supervisor is black. The coefficients for the three variables are all negatively related to ballot rejection rates and lack statistical significance. Thus, as demonstrated by the analysis reported Tables 5S and 6S above, the political affiliation of the county supervisor has no discernible effect on ballot rejection rates. Moreover, the negative signs for the relationship between these three variables and ballot rejection rates directly contradict the rhetoric of Dr. Lott and the dissenters that somehow the presence of black and Democratic supervisors has a positive effect on ballot rejection in Florida's 2000 presidential election.[17]
|
TABLE 9S: REPLICATION OF DR. LOTT S MODELS 2 AND 9, REDUNDANT VARIABLES EXCLUDED |
||||||
|
|
LOTT S MODEL 2 |
LOTT S MODEL 9 |
||||
|
VARIABLE |
REG. COEFF. |
T VALUE |
STAT. SIGNIF. |
REG. COEFF. |
T VALUE |
STAT. SIGNIF. |
|
% BLACK VOTERS |
11.4 |
3.35 |
.001 |
11.3 |
4.36 |
.000 |
|
OPTICAL SCANNING |
3.34 |
1.95 |
.056 |
3.39 |
2.07 |
.043 |
|
PAPER/HAND |
3.1 |
1.40 |
.168 |
3.11 |
1.44 |
.157 |
|
PUNCH |
2.09 |
1.28 |
.205 |
2.09 |
1.33 |
.188 |
|
PRECINCT SCANNING |
-4.73 |
-8.01 |
.000 |
-4.78 |
-8.92 |
.000 |
|
MEDIAN INCOME |
-.0001 |
-1.71 |
.093 |
-.0001 |
-1.70 |
.094 |
|
POVERTY |
4.38 |
.64 |
.527 |
4.25 |
.651 |
.518 |
|
LITERACY |
-.05 |
-.007 |
.994 |
NA |
NA |
NA |
|
R2 |
.790 |
|
|
.790 |
|
|
The next models Models 5 and 13 add two interactive variables. The first such variable is obtained by multiplying by 1 the percentage of black voters for counties with a Democratic supervisor and by 0 for all other counties. The second interactive variable is obtained by multiplying by 1 the percentage of black voters for counties with a Republican supervisor and by 0 for all other counties. The coefficients for both these variables have a negative relationship to ballot rejection rates and lack statistical significance. Likewise the three variables measuring whether the county election supervisor is Democratic, whether the supervisor is Republican, and whether the supervisor is black also lack statistical significance. The variables for Democratic and African American supervisors are negative; the coefficient for Republican supervisor is positive. The only justifiable conclusion from these results is once again that there is no statistically significant relationship between whether election supervisors are Democratic, Republican or African American and either overall ballot rejection rates or racial disparities in ballot rejection rates.
The next models Models 6 and 14 drop the previous interactive variables and substitute a new one that multiplies by 1 the percentage of black registered voters for counties with an African American supervisor and by 0 for all other counties. These models are of no analytic value. These models and all other models including measurement of whether an African American is running the county's elections are based on Dr. Lott s identification of only 4 African American supervisors, too few on which to base any reliable conclusions. Moreover, Dr. Lott's identification is based on the race of supervisors in 2001, not at the time of the election. Based on information provided by the staff of the Commission on Civil Rights, at the time of the 2000 election there was only one African American supervisor, in St. Lucie, which had a ballot rejection rate of .3 percent. Even taking Dr. Lott s model at face value, it fails to show a statistically significant relationship between the interactive variable and ballot rejection rates. Likewise the variables in the model that measure whether supervisors are African American, Democratic, or Republican also lack statistical significance.
Models 7 and 15 include all the interactive variables from previous models. None of these interactive variables has a statistically significant relationship to ballot rejection rates. Likewise the variables in the model measuring whether supervisors are African American, Democratic, or Republican also lack statistical significance. Models 8 and 16, the final two models, suffer from problems of redundant variables similar to Models 1, 2, 9 and 10.
Dr. Lott, in the statistical tables of his revised report, provides results for 27 estimates of the relationship between ballot rejection rates and the partisan affiliation and racial identity of election supervisors. Not a single one of these 27 relationships is statistically significant even at the .1 level that Dr. Lott employs in his report. Thus, Dr. Lott's actual statistical results (as opposed to his discussion of those results) demonstrate decisively that the party affiliation and racial identity of supervisors has statistically discernable influence on ballot rejection rates in Florida s 2000 presidential election.
Dr. Lott compounds his error of ignoring the lack of statistical significance for his results by also using a mathematically invalid procedure for reaching several of his report's rhetorical conclusions. He asserts, the largest effect between the share of votes who are African American and ballot spoilage rates exists when African Americans are county election supervisors (column 6) and a net positive effect also occurs when Democrats are county election supervisors (column 5) (p. 5 Lott Report). He reaches these and all other conclusions about the effects of the party and racial identity of election supervisors on racial disparities in ballot rejection by asserting that the point estimates need to be added together (p. 5). That is, he adds the coefficient measuring differences between black and non-black ballot rejection rates in counties where supervisors are African American with the coefficient measuring differences between black and non-black ballot rejection rates in all counties. Likewise, he adds the coefficient measuring differences between black and non-black ballot rejection rates in counties where supervisors are African American with the coefficient measuring differences between black and non-black ballot rejection rates in all counties.
Unfortunately, these measures are not additive. The coefficient for the percent of black voters within counties having African American supervisors measures disparities in black and non-black rates of ballot rejection in this group of counties, not the difference between racial disparities in those counties and racial disparities in all Florida counties, which include counties with African American supervisors. Likewise, the coefficient for the percent of black voters within counties having Democratic supervisors measures disparities in black and non-black rates of ballot rejection in this group of counties, not the difference between racial disparities in those counties and racial disparities in all Florida counties, which include counties with Democratic supervisors. The addition of a measure of racial disparity in ballot rejection for counties with African American or Democratic supervisors with a measure of racial disparity for all counties is equivalent to measuring racial disparities in counties using punch card technology by adding together the disparities found in the punch card counties with the disparities found in all counties. Had I used Dr. Lott's procedure in my report I could have doubled my estimates of racial disparities in ballot rejection.
There are also contradictions in the results reported by Dr. Lott, which additionally question the accuracy of his data and statistical procedures. For example, in Model 8 Dr. Lott reports a coefficient value for percent of voters who are African Americans (.002) that is three times higher than the coefficient in Model 3 (.00067). Yet he claims that the coefficient in Model 3 is statistically significant, but the coefficient in Model 8 is not. Likewise his coefficient value for percent of voters who are African Americans in Model 1 (.00115) and Model 5 (.0012) are nearly twice as high as in Model 3, but Dr. Lott again claims that these higher values lack statistical significance. In addition, although Dr. Lott and the dissenters argue that the relationship between race and ballot rejection is explained by differences in literacy rates between blacks and whites, in several instances the addition of literacy to Dr. Lott's models actually increases not decreases the positive relationship between race and ballot rejection rates. In Model 1 the coefficient for the variables measuring percent of voters who are African American is .00115, compared to .00073 in Model 9, an identical model with literacy not included. In Model 5 the coefficient for the variables measuring percent of voters who are African American .0012, compared to .0011 for Model 13, an identical model with literacy not included. In Model 7 the coefficient for the variables measuring percent of voters who are African American .0009, compared to .00085 for Model 15, an identical model with literacy not included.
The remaining analyses in the statistical report pertain to comparisons between ballot rejection in 2000 and earlier years and provide no insight into the measurement of racially linked ballot rejection rates in 2000. The dissenters statistical consultant first argues that the lack of a correlation between county-level changes in the percentage of registered voters who are black and changes in the percentage of rejected ballots provides evidence of the lack of a relationship between race and ballot rejection in 2000. Even assuming that his data on rejected ballots for 1996 is correct and comparable to the carefully examined data on rejected ballots for 2000, it is not true that the presence of racial effects in ballot rejection for 2000 produces a positive correlation between change in the percentage of black registrants and changes in the percentage of non-voted ballots over time.
First, the comparison between changes in black voter registration and changes in ballot rejection over time fails to control for changes in technology from 1996 to 2000, which could alter the impact of changes in black registration, even when there are substantial racial disparities in ballot rejection rates. Table 10S provides a numerical example. As indicated in Table 10S, County 1 and County 2 exhibit equal racial disparities in 1996 and continue to display racial disparities in 2000. However, County 1 experiences no increase in the percentage of black registered voters and no change in technology. County 2, however, has a 20 percent increase (the changes depicted on Figure 1 in the dissenters statistical report are almost all within plus or minus 2 percent), but switches from punch card technology to optical scanning technology recorded by precinct, thereby reducing the levels of both black and non-black rejected ballots. The percentage of rejected ballots stays the same in County 1 and declines in County 2 despite an increase in the percentage of black registered voters. This negative correlation between changes in black registered voters and changes in rejected ballots reflects not an absence of racial disparities in ballot rejection, but shifts in technology.
|
TABLE 10S: RELATIONSHIP BETWEEN CHANGES IN BLACK VOTER REGISTRATION AND CHANGES IN BALLOT REJECTION RATE 1996-2000: CHANGING TECHNOLOGY |
||||||
|
|
COUNTY 1 |
VOTING SYSTEM & REJECTION RATE |
REJECTED BALLOTS |
COUNTY 2 |
VOTING SYSTEM & REJECTION RATE |
REJECTED BALLOTS |
|
# OF BLACK VOTER 1996 |
400 (40%) |
PUNCH .10 |
40 |
100 (10%) |
PUNCH .10 |
10 |
|
# OF WHITE VOTERS 1996 |
600 (60%) |
PUNCH .02 |
12 |
900 (90%) |
PUNCH .02 |
18 |
|
TOTAL |
1000 |
|
52 (5.2%) |
1000 |
|
28 (2.8%) |
|
# OF BLACK VOTERS 2000 |
400 (40%) |
PUNCH .10 |
40 |
120 (12%) |
OPTICAL PRECINCT .05 |
6 |
|
# OF WHITE VOTERS 2000 |
600 (60%) |
PUNCH .02 |
12 |
880 (88%) |
OPTICAL PRECINCT .1 |
9 |
|
TOTAL |
1000 |
|
52 (5.2%) |
1000 |
|
15 (1.5%) |
Dr. Lott attempts to answer this criticism by adding to his revised report an Appendix that is not in his initial report that seeks to reexamine the relationship between changes in the percent of African American voters and changes in ballot rejection rates, controlling for technology. However, this additional analysis does not respond to an even more fundamental problem in Dr. Lott's approach. Even in the absence of changes in technology, the changes in ballot rejection rates may be greatest in counties with the highest percentage of black registered voters, not in counties with the largest changes in the percentage of black registered voters. Assume, for example, that the level of rejected ballots increases from 1996 to 2000 and the increase is concentrated among African Americans. As demonstrated in Table 11S, County 1, which is 40 percent African American in voter registration, but experiences no change in black voter registration from 1996 to 2000, will have a 2 percentage point increase in rejected ballots, whereas County 2 will have only a 0.7 percentage point increase even as the black percentage of registered voters soared by 20 percent from 1996 to 2000. Again, this negative correlation between changes in black voter registration and changes in rejected ballots does not reflect a lack of racial disparities in ballot rejection, but, to the contrary, expanded racial disparities between 1996 and 2000.
Dr. Lott also includes Tables attempting to analyze rejected ballots for the elections of 1992, 1996, and 2000. Even assuming Dr. Lott's unreported data for these elections is accurate, this analysis says nothing about the relationship between race and ballot rejection for the presidential election of 2000, the focus of my study. Moreover, the models that Dr. Lott uses for the combined data suffer from the same problems of misspecification as the models of the 2000 election analyzed above.
Professor Klinkner also independently analyzed the dissenters statistical report and likewise found that Lott's findings do not hold up under scrutiny. In particular he found that of the variables that Lott includes in his own models median income, poverty, and the party of the election supervisor not one of Lott's variables is statistically significant. Also, after including Lott's variables in his models, Klinkner notes, the percent of registered voters who are black remains statistically significant. [18]
|
TABLE 11S: RELATIONSHIP BETWEEN CHANGES IN BLACK VOTER REGISTRATION AND CHANGES IN BALLOT REJECTION RATE 1996-2000: SAME TECHNOLOGY, CHANGING RATES OF REJECTION |
||||||
|
|
COUNTY 1 |
VOTING SYSTEM & REJECTION RATE |
REJECTED BALLOTS |
COUNTY 2 |
VOTING SYSTEM & REJECTION RATE |
REJECTED BALLOTS |
|
# OF BLACK VOTER 1996 |
400 (40%) |
PUNCH .05 |
20 |
100 (10%) |
PUNCH .05 |
5 |
|
# OF WHITE VOTERS 1996
|
600 (60%) |
PUNCH .01 |
6 |
900 (90%) |
PUNCH .01 |
9 |
|
TOTAL |
1000 |
|
26 (2.6%) |
1000 |
|
14 (1.4%) |
|
# OF BLACK VOTERS 2000 |
400 (40%) |
PUNCH .10 |
40 |
120 (12%) |
PUNCH .10 |
12 |
|
# OF WHITE VOTERS 2000 |
600 (60%) |
PUNCH .01 |
6 |
880 (88%) |
PUNCH .01 |
9 |
|
TOTAL |
1000 |
|
46 (4.6%) |
1000 |
|
21 (2.1%) |
5. THE DISSENTING OPINION PROVIDES NO CREDIBLE DISCUSSION OF THE ISSUES POSED BY THE STUDY OF BALLOT REJECTION IN FLORIDA S PRESIDENTIAL ELECTION
The following responds to specific arguments presented in the dissenters written report, which relies heavily upon but is not limited to the accompanying statistical report. It will be shown that these arguments fail to undermine the findings of substantial, statistically significant racial disparities in ballot rejection rates in Florida's 2000 presidential election, disparities that are not reducible to non-racial characteristics of voters. Before providing a detailed response to issues raised in the dissenting report, the following summary points need to be considered:
The dissenting report provides no analytic models of its own. It relies on the improperly designed and conducted study of its statistical consultant.
The key hypotheses in the dissenting report that differences in ballot rejection rates for blacks and non-blacks result from differences in literacy, education, and first-time voting are either not tested or are contradicted by the statistical analysis presented by dissenters consultant.
There are contradictions between the dissenters report and their consultant's statistical report, with the dissenters often citing statistical results not found in the consultant's report and picking and choosing among his statistical results.
The dissenters concede that there were major differences in the ballot rejection rate of blacks and non-blacks, probably at least on the order of three to one.
The dissenters, without conducting reliability checks, propagate and rely on media statements about black voting and turnout in Florida that are demonstrably false.
1. The dissenters assert that with respect to my initial report, the analysis by their statistical consultant challenges its main findings. Dr. Lott was unable to find a consistent, statistically significant relationship between the share of voters who were African Americans and the ballot spoilage rate (p. 1). Later in their report they repeat this claim, writing: strong evidence (Dr, Lott's research discussed below) suggests that estimates of major racial disparities in the rate of ballot rejection are entirely wrong (p. 14). The main finding of my initial report was that there were substantial racial disparities in the rate of rejected ballots for African Americans and non-African Americans in Florida's 2000 presidential election. Whether using county-level or precinct-level data, racial disparities were statistically significant at levels far beyond the conventional standards used in social science. Dr. Lott does not challenge these findings. He does not even address these findings in any of his statistical analyses. Dr. Lott neither presents alternative estimates of race-related ballot rejection rates, nor analyzes the estimates presented in my initial report. There are no alternative findings on the rates of ballot rejection for blacks and non-blacks in either the dissenters opinion or the statistical report. Dr. Lott only attempts to address the different question of whether other factors such as income, poverty and literacy account for racial differences in ballot rejection rates.
Even if this claim were true which it decidedly is not as I demonstrate in this supplemental report the burden of ballot rejection would still fall most heavily on blacks and other minorities with low socio-economic status, as Dr. Lott admitted under questioning by Senator Charles Schumer during hearings before the Senate Rules Committee on June 27, 2001. The following is the account of that cross-examination in the New York Times:
Mr. Schumer then wrung out of Mr. Lott a defeated yeah to the question of whether a greater percentage of black and Hispanic people are turned away than, or don't get to vote, than white people? [19]
Thus the dissenters own expert confirmed under examination the key finding of my initial report.
2. The dissenters additionally claim that their consultant's analysis found little relationship at all between racial population change and ballot spoilage (p. 1). As demonstrated above, the analysis upon which this claim is based has no validity given that it rests on false assumptions about the relationship between changes in black registered voters and changes in ballot rejection rates, and uses unverified data on ballot rejection prior to 2000.
3. The dissenters claim they did not have access to the data needed to assess my original report. In fact, I provided with the report a printout of all data and indicated precisely where this data could be downloaded from publicly available sources. It is all data that has been publicly available for months. All of the precinct-level data used in my initial report, as I clearly explained in that report, could be downloaded in a few minutes on spreadsheets from a single Web site: (http://www.ssc.wisc.edu/~bhansen/vote/data.html). The remainder of the data was a small data set for 67 Florida counties that could be readily downloaded or simply entered in a few hours. Independent scholars have had no trouble obtaining or using this data. Indeed, while complaining of a lack of data, the dissenters provided a lengthy statement and accompanying statistical report, with no printout of data and no indication of where the data could be downloaded from publicly available sources.
4. Dissenters argue that estimates of rejection rates for black and non-black voters cannot be obtained from aggregate data such as counties or precincts, citing the so-called ecological fallacy (pp. 14 17). The authors present the problem of analyzing aggregate-level data as though it is a revelation. In fact, the regression methods and reliability checks used in my report were designed for the analysis of aggregate data and are sustained by multiple levels of analysis at both the county and precinct level. The far-fetched examples taken from analyses conducted at the level of states and strained analysis in the dissenters opinion suggests that African Americans lived in counties with mechanisms that somehow produce high ballot rejection rates for the non-blacks living in those counties, but not for the blacks living in the counties. Yet we know that this assumption is false because we have data for some two thousand precincts within counties demonstrating that African Americans within these counties, not the non-African Americans, experience especially high rates of ballot rejection.
The dissenters also strain to make something of the very small differences between the precinct-level ecological regression results and extreme case analysis of precincts that are 90 percent or more black and non-black in Miami-Dade, Duval, and Palm Beach Counties (p. 25). Yet, within a remarkably small margin of error, the results of extreme case analysis powerfully confirm the pattern of major disparities between ballot rejection rates for blacks and non-blacks. Five of the six estimates of ballot rejection rates from extreme case analysis repeated in the dissenters statement are within a single percentage point of the estimates derived from ecological regression and the remaining estimate is within 1.5 percentage points. The mean difference between the six findings of ecological regression and extreme case results cited in the dissenters report is less than half a percentage point.
5. The dissenters write, the size of the black population (by Dr. Lichtman's own numbers) accounts for only one-quarter of the difference between counties in the rate of spoiled ballots (the correlation is .5) (p. 17). They additionally claim that a model developed by Dr. Lott enables us to explain 70 percent of the variance (three times as much as Dr. Lichtman was able to account for) without using the proportion of African American in each county as a variable (p. 18).
As explained in my first report, I drew no conclusions from the correlation between race and ballot rejection across counties it was only a starting point for analysis. Given that this correlation does not take into account differences in the voting technologies and that African Americans comprise only about one in ten of Florida's voters, it is remarkable that racial composition alone explains 25 percent of the cross-county variation in ballot rejection.
Their claim that their model explains 70 percent of the cross-county variation without considering racial composition, is meaningless, because any model could increase the percentage of explained variation by including enough variables that are correlated with race. But dissenters present no such model. Their only models of ballot rejection in the 2000 Florida election are found in Table 3 of their consultant's statistical report: all of these models include some measure of the racial composition of counties and all control for voting technology.[20] The results presented in Table 5S and Table 6S of this report, which includes racial composition, explain not 70 percent of the variation, but nearly 90 percent of the variation in ballot rejection rates. In contrast, the best of Dr. Lott's 16 models explains 79.5 percent of the variation in ballot rejection rates. Finally, as demonstrated in Table 12S, a model that includes only the percentage of blacks in a county and controls for voting technology tops the 70 percent of explained variation that is so highly touted by the dissenters. That is, simply knowing what technology is used in counties and how Florida's small proportion of black voters is apportioned among counties accounts for 74 percent of the cross-county variation in ballot rejection rates. The explained variation from this simplest of models is actually greater than the explained variation of 8 of the 16 models presented in Table 2 of the dissenters statistical report.
6. Dissenters write, The obvious explanation for a high number of spoiled ballots among black voters is their lower literacy rate (p. 20). Dissenters made this same claim in their initial Senate report, even though their statistical consultant did not test for the influence of literacy on ballot rejection rates in any of his models. They continue to make the assertion in the current report even though Dr. Lott has now tested for the influence of literacy and his results decisively reject the thesis that literacy had a statistically significant effect on ballot rejection rates.[21] The dissenters discussion of literacy does not even reference their own consultant's negative findings on the central hypothesis of their report. Yet, as indicated above, in 7 of Dr. Lott's 8 new models, the relationship between literacy and ballot rejection rates lacks statistical significance even using his .1 level of significance. Likewise the comprehensive models presented in this report and the independent analysis by Dr. Klinkner show that neither literacy nor education has a statistically significant independent effect on ballot rejection rates.[22]
|
TABLE 12S: THE INFLUENCE OF RACE ON BALLOT REJECTION RATES 2000 PRESIDENTIAL ELECTION IN FLORIDA, CONTROLLING ONLY FOR VOTER TECHNOLOGY, COUNTY DATA |
|||
|
|
|
|
|
|
VARIABLE |
REG. COEFF. |
T VALUE |
SIGNIF. |
|
BLACK VOTERS |
.132 |
5.57 |
.000 |
|
PUNCH CARD |
3.32 |
7.58 |
.000 |
|
OPTICAL CENTRAL |
5.36 |
9.78 |
.000 |
|
PAPER/LEVER |
2.88 |
2.18 |
.033 |
|
R2 = .742 |
|
|
|
The dissenters also claim it is counterintuitive to suggest that race influenced ballot rejection independent of literacy and to advocate education for voters, for election officials, and for poll workers. However, the simple point is that such programs would ensure that technologies designed to reduce ballot rejection would be properly applied, administered and understood by all involved in the process of voting, especially given that much new technology will be used for the first time in many Florida counties in the next election.
Finally, the dissenters assail the literacy data itself hardly possible if they had no access to this data. They note in passing that the data has confidence intervals of about 6 percent, without showing why that would be problematic for assessing differences in literacy for counties. More important, they claim that literacy data is not broken down by race (pp 21 22, emphasis in original). Leaving aside the fact that Census data on education is broken down by race, the dissenters argument misunderstands the basic foundations of statistical analysis. To test the dissenters hypothesis that literacy independent of race was responsible for differential ballot rejection rates between blacks and non-blacks, a statistical model would obviously need to include a measure of overall literacy for all races, not a measure limited only to blacks. A measure of black literacy alone would not help to assess the influence of literacy on ballot rejection, independent of race. Surely dissenters do not mean to claim that blacks lacking literacy skills, but not non-blacks lacking literacy skills, might have problems in coping with Florida's presidential ballot. Their own statistical consultant in testing the influence of poverty and income on ballot rejection rates did not include in his model rates of black poverty and income, although such measures are readily available from the Census. Instead he used overall poverty and income measures for each county, to test whether economic standing influenced ballot rejection rates independent of race. Once again, there is a fundamental lack of connection between what is asserted in the dissenters opinion and the analyses conducted or not conducted in their consultant's statistical report. The point of statistical analysis is to study the patterns of relationships across the units studied. If literacy, not race, produced differentials in ballot rejection this should be disclosed by patterns in the relationships across counties involving ballot rejection rates, race, and literacy.
7. Dissenters argue that the prevalence of first-time voters may be partly responsible for the high rates of ballot rejection for African Americans, although like their hypotheses on literacy and education they never test this proposition empirically (p. 23). They also note that according to estimates widely cited in the press, as many as 40 percent of the African Americans who turned up at the polls in Florida had never voted before (p. 22). It is surprising that the dissenters should be propagating unsubstantiated statistics from the media without performing any reliability tests. They also ignore the information that is now available on first-time voting in Florida. This data, based on individual records of voting identified by race and date of first voting, indicates that fewer than 25 percent of African Americans were first-time voters in 2000 and that the difference between first-time voting among African Americans and non-African Americans was only about four percentage points.[23] Unlike the dissenters statistical consultant I used the newly available information to test the influence of first-time voting on ballot rejection rates, finding that it had no statistically significant effect of its own and did not diminish the relationship between race and ballot rejection.
The dissenters also asserted in their initial report to the Senate that it was reported, the African American share of the total vote was larger than the black share of the state's population (p. 22, initial report), which is 15 percent. They now withdraw this claim, citing a press report by Frank J. Murray that blacks actually constituted only about 10 percent of voters. They go on to say, Dr. Lichtman did not know what the figures only released in July of 2001 would show (p. 24). Unlike the dissenters, however, I did not uncritically accept media reports but conducted an ecological regression analysis of black and non-black turnout (referenced in footnote 9 of my initial report), which accurately found that the percentage of blacks among voters was slightly lower than the 11 percent share of blacks among registrants. The same Murray article that the dissenters cite in their report, acknowledged the accuracy of my ecological regression analysis, indeed conducted before the new information became available.
8. The dissenters argue that my analysis should have examined prior presidential elections in Florida in addition to the 2000 contest (p. 23). My analysis, however, focused on the question of exploring differences in black and non-black ballot rejection rates in 2000. If reliable data were available it might be interesting to conduct studies of earlier elections, but that would not change what happened in 2000. As explained above, the dissenters consultant uses flawed methods to compare the 2000 experience with earlier elections. He also provides no estimates for race-related ballot rejection rates in either 1992 or 1996.
9. The dissenters imply that a lack of data prevented them from replicating or extending the precinct-level analysis from my first report (p. 26). They even say that if they had access to the data they would surely have found my results to be problematic. This is perhaps the most puzzling and troubling claim of many in the dissenters statement. I provided as an appendix to my first report printouts of all precinct-level data and explained that the data is publicly available on a single Web site and could have been readily downloaded in machine-readable spreadsheet form. Remarkably, the dissenters and their statistical consultant compiled a new data set on presidential elections that I did not examine in my report a data set that they do not print out for verification. Yet they did not take the few minutes needed to download the precinct-level data the most refined data available on ballot rejection rates by race in the 2000 presidential election and data that could have readily been checked against my printouts.
Such research procedure would be inexplicable if the dissenters truly wanted to find out the truth about what happened in Florida s presidential election as opposed to just obscuring the plain as day finding of major racial disparities in ballot rejection rates. Clearly, the dissenters chose not to analyze precinct-level data because any such analysis would commit them to confirming the substantial differences in ballot rejection rates for blacks and non-blacks that is so evident in the precinct-level returns. They go to great lengths, including this patent smokescreen about a lack of data, to avoid putting their imprimatur on any empirical work that would demonstrate the existence of racial disparities in ballot rejection in Florida's 2000 presidential election.
10. With respect to precinct-level results dissenters argue that ballot rejection rates dropped dramatically when the precinct numbers were examined (p. 26). In fact, ballot rejection rates were higher for the precinct-level results than for the county-level results in my first report, including the rate for blacks. As compared to an estimated ballot rejection rate of 14.4 percent for blacks based on county-level data, the estimated ballot rejection rate based on precinct-level data was 23.6 in Duval County and 16.3 percent in Palm Beach County. Only Dade County, with a ballot rejection rate of 9.8 percent, fell below the county-level estimate for the state. The disparity between black and non-black rejection rates is higher than the statewide estimate in Duval County and lower in Dade and Palm Beach Counties. When the three additional counties studied for this report are considered, the black rejection rate is higher than the statewide estimate in four of six counties studied with precinct data (Duval, Escambia, Gadsden, and Palm Beach). Racial disparities are greater than the statewide estimate in three of six counties studied (Duval, Escambia, and Gadsden).
The main thrust of the dissenters argument rests on differences in ratio of black to non-black ballot rejection rates for the state overall and within individual counties. Surely the dissenters understand the essential difference between a ratio computed within individual counties and a ratio computed across all counties, which comprises differences within counties, differences across counties, and differences in the racial composition of each county. Yet they persist in making their apples and oranges comparison. The within-county ratios range from about 3 to 1 in Palm Beach County to about 10 to 1 in Escambia County. The 10 to 1 ratio in Escambia does not mean that the statewide estimate understates the ratio between black and non-black rejection rates any more than the 3 to 1 ratio in Palm Beach means that the statewide estimate overstates this ratio. The within-county analysis does not include three of the four counties with the largest percentages of African Americans all of which have high rates of ballot rejection or the many heavily white counties with extremely low rejection rates. To argue that because precinct-level data is better than county-level data that a statewide estimate should mirror a within-county ratio is to confuse the instrument of measurement with the results of measurement.
The dissenters also speculate that the differences found at the precinct-level between blacks and non-blacks may be the result of differences between blacks and non-blacks in their income and educational levels. Yet both the multivariate analysis presented in this report as well as the analysis of dissenters own expert provide no support for the proposition that income and education explain ballot rejection rates. Moreover, I tested this proposition empirically at the precinct level in Dade County. Even though Hispanics had substantially lower educational levels than African Americans in Dade County, African Americans had much higher levels of ballot rejection.
Ironically, the dissenters ultimately plead for us to affirm that the statewide ratio of rejected ballots for African Americans and non-African Americans should mirror the lowest of the within-county ratios, which is about three to one. The dissenters concluded: If precinct-level analysis yields better estimates than county-level estimates, the actual disparity in rates of ballot spoilage in Florida as a whole was probably far below nine to one. In fact, it was about three to one (p. 28). Thus after all their inflammatory rhetoric, the dissenters are reduced to pleading (however fallaciously) that ballots cast by African American ballots really were rejected at a rate only triple that of ballots cast by non-African Americans, as though a 300 percent racial disparity in rejection rates was no cause for concern.
The dissenters also know that very small changes in the non-black percentage of rejected ballots can produce very large changes in ratios. Contrary to what dissenters imply, it is crucial to focus as I did consistently in my report on the magnitude of the difference between non-black and black ballot rejection rates, because percentage point differences indicate how many voters are impacted by differential ballot rejection rates. In Duval County, for example, the difference between rejection rates for African Americans (23.6) and non-African Americans (5.5) is more than 18 percentage points, despite a ratio of only 4.5 to 1. In Gadsden County, the difference between rejection rates for African Americans (21.6) and non-African Americans (4.4) is more than 17 percentage points, despite a ratio of only 5 to 1. In both Duval and Gadsden, as compared to non-African Americans, nearly an additional one in five African American voters had their ballots rejected. Such a disparity in rejection rates affects far more voters than would, for example, rejection rates of 0.2 percent for African Americans and 2.2 percent for non-Americans, even though the ratio in this example is 11 to 1. Overall, both the within-county and the state estimates produce similar double-digit percentage point differences in rejection rates for blacks and non-blacks. Projected statewide, these disparities mean than some 60,000 additional black votes would have counted in 2000, if ballots cast by blacks had been rejected at the same rate as ballots cast by whites.
11. Dissenters claim that according to their consultant's report having a Republican election supervisor reduces ballot rejection rates and having a Democratic supervisor increases ballot rejection rates. In addition to all the problems with Dr. Lott's analysis of the relationship between ballot rejection and the partisan identity of supervisors, the dissenters again reference statistics that are not contained in Dr. Lott s report.
The dissenters cite Dr. Lott's Table 3 to claim: There was indeed a relationship between having a Republican running the county s election and the ballot spoilage rate. But it was a negative correlation of -.0467. Having a Democratic supervisor of elections was also correlated with the spoilage rate by +.424 (p. 29). The actual statistics from Dr. Lott s Table 3 are reported in Table 13S below. One searches in vain to find either of these statistics cited by dissenters in any of his models. In fact, there is not a single model in which the relationship between having a Republican running the county elections and ballot spoilage rates is negative and the relationship between having a Democrat running the county elections and ballot spoilage rates is positive. There is one model, however, Model 5, which has a positive relationship between having a Republican running the county elections and ballot spoilage rates, and a negative relationship between having a Democrat running the county elections and ballot spoilage rates. Model 7 has a positive relationship for both Republican and Democratic supervisors. And Model 5 has a positive relationship for Republican supervisors only. Thus Dr. Lott finds that in two of five models having a Republican running the county elections increases ballot rejection rates, whereas in only one of five models does having a Democrat running the county elections increase ballot rejection rates. Of course, as noted above, but ignored by dissenters, none of these relationships, whether positive or negative, is statistically significant.
Dissenters also say, Lott estimates that a 1 percent increase in the black share of voters in counties with Democratic election officials increases the number of spoiled ballots by a striking 135 percent (p. 30). Again, no such result is found in Lott's estimates. Lott's Table 3 shows that his variable measuring percent of voters who are African American and whether the county election supervisor is a Democrat has a negative not a positive relationship to ballot spoilage in both the models in which Dr. Lott includes the variable. The coefficient for this variable is -.00056 for Model 5 and -.00046 for Model 7. Again, neither coefficient is statistically significant.14
|
TABLE 13S: DISSENTERS STATISTICAL REPORT TABLE 2: THE EFFECT OF HAVING A REPUBLICAN OR DEMOCRATIC ELECTION SUPERVISOR ON BALLOT REJECTION RATES * |
|||||
|
MODEL NUMBER
|
4 |
5 |
6 |
7 |
8 |
|
REPUBLICAN ELECTION SUPERVISOR |
|
|
|||
|
COEFFICIENT |
-.009 |
+.007 |
-.0124 |
+0034 |
-.020 |
|
T-VALUE |
-.702 |
+.337 |
-.953 |
+.148 |
-1.667 |
|
STATISTICAL SIGNIFICANCE |
NONE |
NONE |
NONE |
NONE |
NONE |
|
DEMOCRATIC ELECTION SUPERVISOR |
|
||||
|
COEFFICIENT |
-.0058 |
-.0052 |
-.0077 |
+.0028 |
-.016 |
|
T-VALUE |
-.478 |
-.220 |
-.628 |
+.117 |
-1.387 |
|
STATISTICAL SIGNIFICANCE |
NONE |
NONE |
NONE |
NONE |
NONE |
|
* THESE ARE THE ONLY MODELS FOR WHICH DR. LOTT REPORTS RESULTS FOR VARIABLES MEASURING THE PARTY AFFILIATION OF ELECTION SUPERVISORS. |
|||||
12. Finally, the dissenters complain that I did not study ballot rejection rates for Hispanics as well as African Americans. A study of ballot rejection rates for Hispanics is a legitimate project, but that does not undermine the validity of a study that focuses on African Americans. Moreover, although dissenters discuss the percentages of Hispanics in Florida s population, they ignore evidence presented by their own consultant that Hispanics are a small proportion of registered voters in Florida, with percentages much lower than for African Americans.[24] Miami-Dade County is the only Florida county with a substantial concentration of Hispanic registrants and Table 3S above reports the results of an analysis that distinguished between Hispanic and black ballot rejection rates. The results reported in Table 3S show that the rejection rate for Hispanics was higher than the rate for whites, but substantially lower than the rate for African Americans. Moreover, dissenters once again pick and choose from their consultant's results, ignoring the statistics in Dr. Lott's Table 3, which shows that in 7 of 8 models that has a measure of Hispanics in the population or among voters, the relationship with ballot rejection is negative.
CONCLUSION
In sum, as both my initial report and this supplement demonstrate, there were major racial disparities in ballot rejection rates in Florida's 2000 presidential election. Dissenters and their statistical consultant present no evidence contradicting this finding and both Dr. Lott s testimony before the Senate and dissenters written statement even concede the existence of substantial racial differences in ballot rejection. Additional analyses presented in this report also show that such disparities are not attributable to factors cited by dissenters such as education, income, literacy, and first-time voting. In their efforts to attribute racial disparities in ballot rejection to other factors, dissenters either fail to conduct the necessary statistical tests or ignore the results of such tests. The statistical report on which the dissenters rely provides no credible models of ballot rejection in the 2000 presidential election in Florida. It is past time to cease arguing about the existence of racial disparities in ballot rejection and to start making sure that all voters have the greatest possible opportunity to cast legally valid ballots in future elections.
[1]
It should be noted the dissenters report and Dr. Lott's statistical
analysis are revisions of earlier documents submitted to the Senate and the
media in late June of 2001. Where necessary this report will draw upon the
information contained in the original report and accompanying statistical
analysis.
[2]
Ballot rejection data Broward and Escambia was available on Professor
Hansen's Web site referenced in my first report. I received registration
data by race directly from each county supervisor of elections. Data for
Gadsden County was obtained from the voter record lists of individual
voters.
[3]
The multiple regression analyses are unweighted so that the explanatory
power of each model can be compared directly to the models of ballot
rejection in the 2000 presidential election that the dissenters
statistical report presents in Table 2. The use of weighted regression,
however, would not change any of the interpretations offered in this report.
[4]
It should be noted that the only socio-economic variable that has a
statistically significant influence on ballot rejection rates is the
percentage of persons with less than a 9th grade education. The models
presented by Dr. Lott do not include this variable or any other measure of
educational attainment.
[5]
Weighted regression produces an even larger coefficient for the percentage
of black voters.
[6]
The value for weighted regression is .120.
[7]
Professor Klinkner downloaded relevant data from the publicly available
sources identified in my original report and independently developed several
comprehensive county-level models of ballot rejection in Florida s
presidential election.
[8]
Philip A. Klinkner, Whose Votes Don't Count? An Analysis of Spoiled
Ballots in the 2000 Florida Election, submitted to the United States
Senate Committee on Rules.
[9]
These percentages represent the maximum number of first-time voters, given
that some voters may have voted in other states or prior to 1994, but would
be indicated as first-time voters on the individual records for 2000.
[10]
This measure will slightly overestimate first-time voting because voters may
have voted in other states or have voted prior to 1994, when the records
begin.
[11]
A .1 level of statistical significant corresponds to a probability of 10
percent of obtaining a statistical result under the hypothesis that the
statistic was produced by chance or random variation. This is a very lenient
standard. The more conventional standards of .05 and .01 correspond
respectively to probabilities of 5 percent and 1 percent of obtaining a
statistical result under the hypothesis that the statistic was produced by
chance or random variation.
[12]
My initial report, like this report, included a printout not just of
literacy but also of all data used. All my data had been publicly available
on the Web for months it is primarily election and registration data
generated by the State of Florida and I specified the Web sites from which
it could be readily downloaded. In contrast to my presentation of data and
sources, the dissenters provided no printout of the underlying data so that
it could be checked or verified or any specification of where the data could
be obtained from publicly available sites on the Web. Thus, to the extent
that the dissenting report provides any data not included in my initial
report, such data is unverified and, as will be demonstrated below, highly
suspect.
[13]
Sanford Weisberg, Applied Linear Regression (New York: John Wiley and
Sons, 1985), p. 196; Eric Hanushek and John E. Jackson, Statistical
Methods for Social Scientists (New York: Academic Press, 1977), p. 131.
[14]
For the five counties studied, the lowest value of the t-statistic measuring
the statistical significance of the relationship between race and rejected
ballots is 14.0, corresponding to a probability of well under one in one
million of obtaining a positive relationship under the chance or random
hypothesis.
[15]
Dr. Lott mistakenly attributes his use of redundant variables to the
analysis presented in my initial report saying, I started out using all
the variables reported in their Appendix 1 and the literacy rate. (see
Column 1 in Table 3) (p. 4). In fact, I did not use in my report or
include in my Appendix 1 any of the redundant population variables that Dr.
Lott includes in the model reported in Column 1 and many of his other
models. Dr. Lott's improperly specified models are his own responsibility.
[16]
The dissenters models also have an erroneous specification of technology,
including both optical scanning and scanning by precinct in their design,
two variables with considerable overlap.
[17]
Dr. Lott also includes a Table (Table 2) in his report showing that counties
with Democratic and non-partisan supervisors had, on average, higher ballot
rejection rates than counties with Republican supervisors. Yet Democratic
and non-partisan tended to be concentrated in counties with higher
percentages of blacks and in counties that did not use optically scanning
technology recorded by precinct.
[18]
Klinkner, op. cit.
[19]
Katherine Q. Seelye, Senators Hear Bitter Words on Florida Vote, New
York Times, June 28, 2001.
[20]
Dr. Lott makes a similar claim in his report, without presenting any such
model. (p. 4) In yet another contradiction, dissenters assert that
removing race from the equation but leaving in all the other explanatory
variables only reduced the amount of ballot spoilage explained by his
regression from 73.4 percent to 69.1 percent, only a mere 4.3 percentage
point reduction. (p. 20), whereas Dr. Lott asserts removing the share
of voters who are African American reduces the amount of variation in ballot
spoilage from 73.9 percent to 72.2 percent, a 2.3 percent reduction. (p.
4) Of course, absent a model it is not possible to verify either claim.
[21]
Unlike the models used in this report, he still fails to include educational
measures in any of his 16 models.
[22]
The models developed in this report and by Professor Klinkner in the report
he submitted to the Senate are far more comprehensive than the models in the
work by Judge Posner cited briefly by dissenters (p. 22). It is also
puzzling that dissenters should attack my literacy data but endorse
Posner's use of the same data. Moreover, the dissenters cite Judge Posner
on literacy, but not the work of their own expert. The dissenters also fail
to inform their audience, although they were themselves informed, that Judge
Posner's data set erroneously tabulates the literacy data. For several
counties beginning with the letter M, including Miami-Dade, his data
transposes the literacy statistics. Judge Posner's data can be found on
his Web site: <http://home.uchicago.edu/~rposner/election>.
[23]
The individual voter files indicate that 24.7 percent of African American
voters were first-time voters. However, as indicated above, this percentage
is on overestimate, given that some voters may have voted in other states or
prior to the first date of voting listed on current records.
[24] Dissenters Statistical Report, Table 1 shows a mean of 2.45 for the percentage of voters who are Hispanic, compared to a mean of 9.55 for the percentage of voters who are African American.